Harvest Loss Calculator
Estimate crop loss across preharvest, header, threshing, cleaning, moisture shrink, acreage, and combine pace.
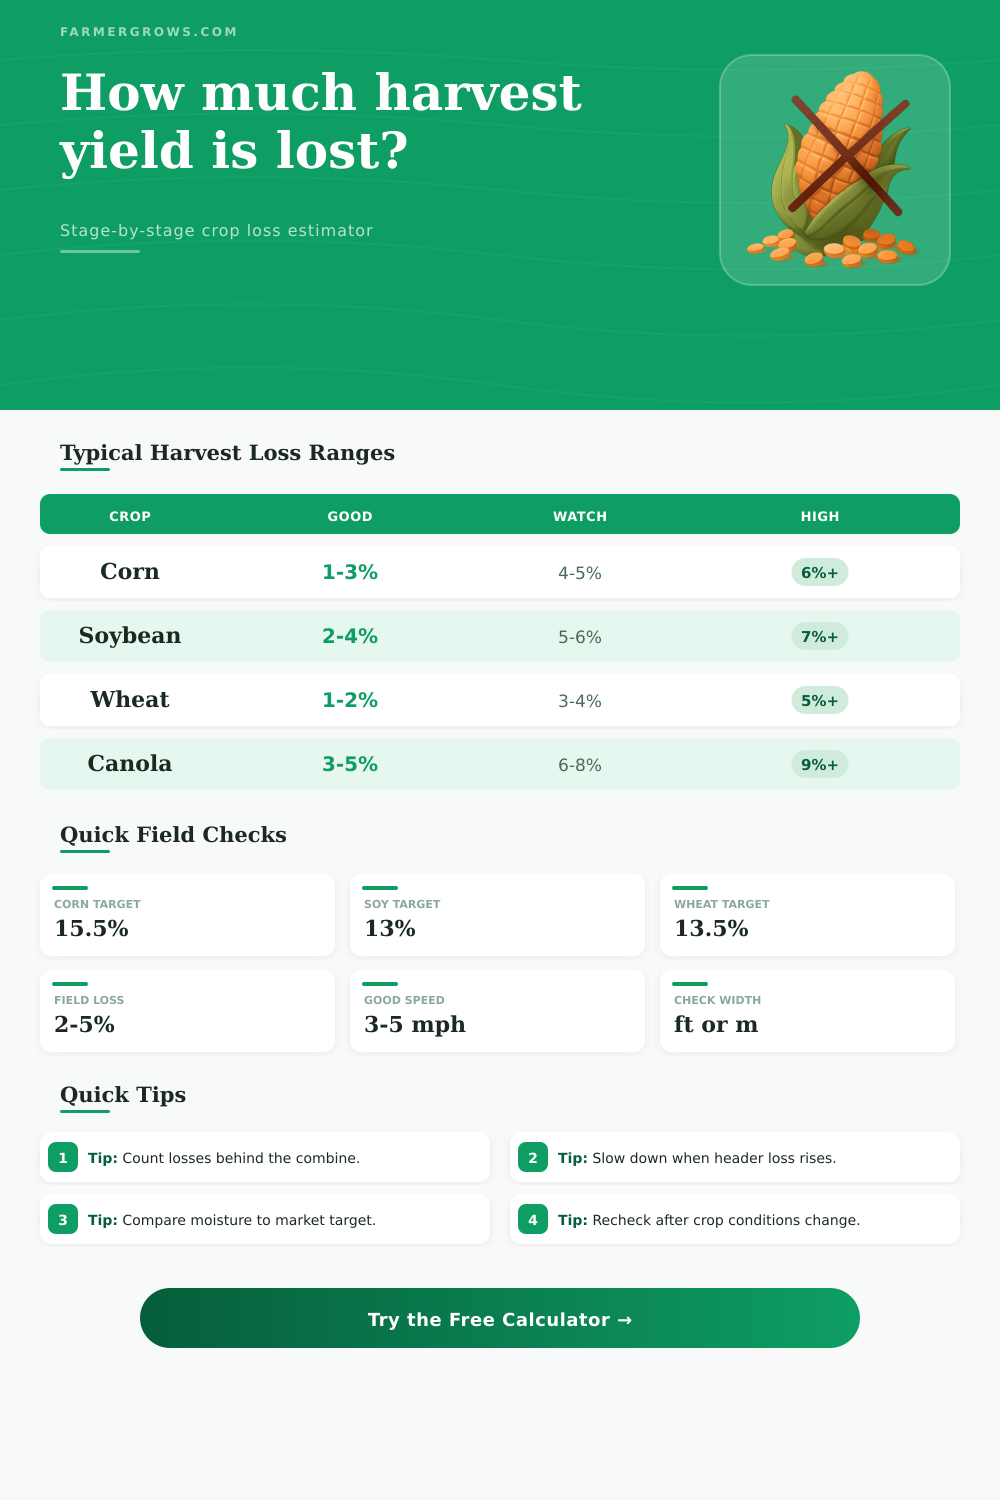
Corn grain uses bushels and 15.5% target moisture.
Harvest Loss Results
| Crop | Preharvest | Header | Threshing | Cleaning |
|---|---|---|---|---|
| Corn grain | 0.5-1.5% | 1-3% | 0.2-0.8% | 0.2-0.6% |
| Soybean | 1-3% | 1.5-4% | 0.4-1% | 0.2-0.8% |
| Wheat | 0.3-1% | 0.5-2% | 0.3-0.9% | 0.2-0.7% |
| Rice | 0.5-2% | 1-3% | 0.5-1.5% | 0.4-1% |
| Canola | 2-5% | 1-3% | 0.5-1.2% | 0.3-0.8% |
| Crop type | Market target | High moisture check | Calculator use |
|---|---|---|---|
| Corn grain | 15.5% | Over 20% | Water shrink estimate |
| Soybean | 13% | Over 15% | Storage-ready comparison |
| Wheat | 13.5% | Over 15% | Dry bushel adjustment |
| Rice | 14% | Over 18% | Dry yield comparison |
| Sunflower | 10% | Over 12% | Marketable weight check |
| Effective width | Ground speed | Acres per hour | Hours per 100 acres |
|---|---|---|---|
| 20 ft | 3.5 mph | 6.1 ac/hr | 16.4 hr |
| 25 ft | 4 mph | 8.7 ac/hr | 11.5 hr |
| 30 ft | 4.5 mph | 11.8 ac/hr | 8.5 hr |
| 35 ft | 5 mph | 15.3 ac/hr | 6.5 hr |
| 40 ft | 5.5 mph | 19.2 ac/hr | 5.2 hr |
| Crop | Sample method | Loss clue | Adjustment to check |
|---|---|---|---|
| Corn | Ear and kernel counts | Kernels behind head | Deck plates and speed |
| Soybean | Seeds per square foot | Pods cut or shattered | Reel, cutterbar, ground speed |
| Wheat | Heads and loose grain | Unthreshed heads | Rotor speed and concave |
| Rice | Panicles and grain trail | Loose grain in straw | Fan speed and sieve setting |
| Canola | Seed counts on tray | Header shatter | Knife height and reel position |
Harvest loss are the losses of grain that occur during the harvesting process. There are many different way in which harvest losses can occur. Harvest losses dont always occur at the same time, but instead, the losses often occur in small amount throughout the growing season.
The grower can use the calculator to track the number of bushels that are lost during the harvest because the calculator provide information regarding the amount of grain that is lost. To use the calculator, the grower will need to input field for the expected yield for the field, the total acreage of the field, and the percentage of the crop that is lost at each stage of the harvest process. Preharvest loss is the amount of grain that fall to the ground before the combine reaches the crop.
How to Measure and Reduce Harvest Loss
Preharvest loss can be the result of lodging, weather, or the shattering of the grain prior to harvest. Header loss is the amount of grain that is lost with the cutterbar as it moves through the field. A farmer can only properly measure header loss by counting the amount of grain behind the machine, not by guessing how much grain is behind the combine.
Threshing and cleaning loss is the amount of grain that is lost while the combine is performing its harvesting functions of threshing and cleaning the grain. Threshing and cleaning loss can be the result of the speed at which the rotor moves, the amount of space between the concave and the threshing cylinder, the settings of the fan on the combine, and the settings of the sieves on the combine. Moisture shrinkage is the amount of weight that the grain lose due to the loss of water in the grain after the combine reaches the buyer.
Moisture shrinkage is important to consider in that moisture shrinkage can have a major impact upon the value of the crop the same as header loss can impact the value of that crop. The grower must complete the fields for combine width and ground speed in the calculator because the width of the combine and the ground speed of the combine will determine the amount of acres that can be covered during the harvesting process. Although it may seem efficient for a farmer to utilize a wide header for the combine and to use high ground speed, both of these variables will contribute to the header loss of that crop.
The calculator allows for estimation of the capacity of the combine so that the grower can decide if reducing the ground speed will lead to increased yield of grain from that combine. The grower can utilize the reference table as different crops will react differently to the same settings of the combine. For instance, corn kernels will remain within the cob until the header of the combine knocks the kernels loose from the cob, but the pods of canola plants may shatter as a result of the vibration of the reel of the combine.
Furthermore, the heads of wheat may slide under the cutterbar of the combine and become lost in the stubble of that field, so the wheat heads will never enter the combine. It is important for the grower to know the normal loss percentages of these crops, otherwise the grower may either attempt to fix problem that dont exist with the crop, or the grower may accept losses of the crop that can be avoided with adjustments to the combine settings. Field checks can be made to the fields that are to be harvested with the combine.
These checks will provide the grower with information about the field that is more detailed than the information provided from the combine calculator. For instance, the grower can go behind the combine and use a tape measure and flags to determine if the fields are losing their yield to issue with the header, issues with the middle part of the field, or issues with the straw. Such information will allow the grower to determine which part of the combine needs to be adjusted, and the calculator will show the grower how that adjustment will impact the total acreage of the combine.
Pay attention to moisture shrinkage of the crop. Moisture shrinkage is easy to neglect when harvesting crops, but it is important to know that each type of crop contains a target moisture level. If the moisture level of the grain in the field is above the target moisture level of the crop, the calculator will use a shrinkage formula for the grain to determine the true marketable bushels of that harvested grain.
Many farmers will calculate the marketable bushels of the harvested grain at the moisture level of the field at harvest time, and they will calculate the marketable bushels of the harvested grain at the target moisture level to determine if using a dryer to reduce the moisture level of the crop is cost-effective. Combine capacity can change based off the condition in the field. The capacity of the combine will not always be the same.
For instance, the combine may be able to cover more acre per hour in fields of dry wheat than it can cover in fields of green straw. The calculator incorporates an efficiency factor in the time estimate for the combine to ensure that the hours needed for the combine to complete its field is realistic. This realistic time estimate for the combine will prevent the grower from making the decision that the combine will take the same amount of time every year to complete each field.
In addition to the information that the calculator provides, tracking these different variable will allow the grower to see patterns in their fields over many growing seasons. For instance, if a grower measures the header loss of soybean fields every year, over time the grower will be able to recognize whether the header loss of that field is related to the lodging of the soybean plants in those fields. Additionally, recognizing the pattern in which the combine loses grain at certain stage of the process will allow the grower to make decisions regarding the type of crop that may be planted in those fields, or even at what time in the season the crops should be harvested.
Finally, recognizing the pattern of losses will allow the grower to recognize losses that can be avoided, such as small reductions in the loss of grain during the cleaning process of the combine, or small reductions in moisture shrinkage. Thus, tracking combine losses will allow the grower to bring more grain from the field to the farm.