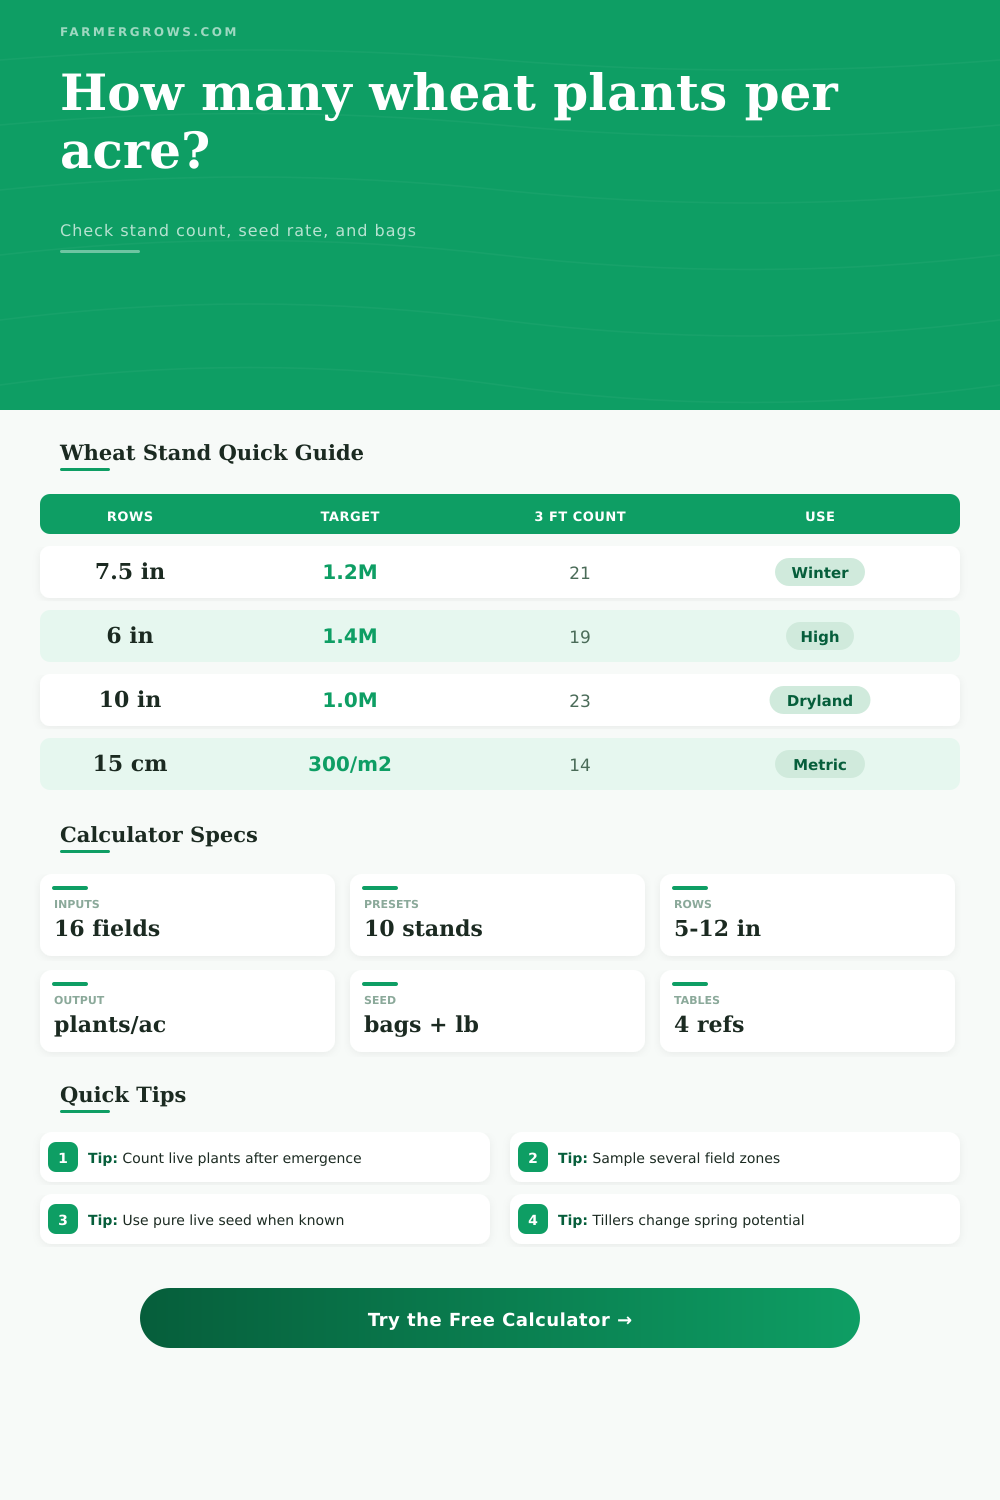
Wheat Plants Per Acre Calculator
Convert drilled wheat stand counts into plants per acre, compare the stand with your target, estimate seeding rate, seeds per foot, bags, tillers, and head potential.
Use live wheat plants after emergence, before heavy winterkill or spring tillering hides the original stand. Average several counts across soil types, residue levels, drowned areas, and headlands before making a replant or overseeding decision.
Wheat Stand Results
Your wheat stand estimate will appear here.
| Row spacing | Plants per ft for 1.0M/ac | Plants per ft for 1.2M/ac | Plants per ft for 1.4M/ac | Metric note |
|---|---|---|---|---|
| 6 in | 11.5 | 13.8 | 16.1 | 15.2 cm rows |
| 7.5 in | 14.4 | 17.2 | 20.1 | 19.1 cm rows |
| 8 in | 15.3 | 18.4 | 21.4 | 20.3 cm rows |
| 10 in | 19.1 | 23.0 | 26.8 | 25.4 cm rows |
| 12 in | 23.0 | 27.5 | 32.1 | 30.5 cm rows |
| Seed size | Target plants/ac | 80% establishment | 85% establishment | 90% establishment |
|---|---|---|---|---|
| 12,000 seeds/lb | 1.2 million | 125 lb/ac | 118 lb/ac | 111 lb/ac |
| 14,000 seeds/lb | 1.2 million | 107 lb/ac | 101 lb/ac | 95 lb/ac |
| 16,000 seeds/lb | 1.2 million | 94 lb/ac | 88 lb/ac | 83 lb/ac |
| 14,000 seeds/lb | 1.4 million | 125 lb/ac | 118 lb/ac | 111 lb/ac |
| Field situation | Stand clue | What to check next | Likely action |
|---|---|---|---|
| On-time winter wheat | 23+ plants/sq ft | Crown health and tillers | Usually keep |
| Late winter wheat | 28+ plants/sq ft | Spring nitrogen and gaps | Usually keep |
| Thin winter wheat | 15-22 plants/sq ft | Uniformity and calendar | Scout closely |
| Spring wheat | 28+ plants/sq ft | Planting date and moisture | Usually keep |
| Patchy drowned areas | Variable counts | Percent field affected | Spot repair |
| Method | Best use | Formula used | Sampling tip |
|---|---|---|---|
| Measured row | Drilled rows | Plants divided by sampled row area | Use several short row lengths |
| Square-foot frame | Narrow rows | Plants per frame area | Drop frame randomly |
| Square-meter frame | Metric scouting | Plants per m2 to acre | Convert automatically |
| Head count | Spring yield check | Plants times productive tillers | Separate plants from tillers |
Count the weakest acres separately. If drowned zones, crusted strips, or drill skips cover only a small share of the field, the whole-field plants per acre can look better than the trouble spots deserve.
Keep plants and tillers separate. Plant population tells you establishment. Productive tiller counts tell you spring compensation, head density, and whether nitrogen timing can still support yield potential.
You can’t harvest hope; you can only be precise with wheat. You can drill it perfectly uniform across a field, and yet still go home with a thin stand of nothing but weeds. When the combine rolls by with its header down, it doesn’t matter why, just what happens. Will those green shoots in the ground become heads? If so, how many?
Plant counts per acre become a strategy, not a chore. And most growers has to go by looks (which is where things go wrong). Eyes are a poor measuring tool for density. Plug your plant count and row spacing into the calculator (above), and it will do the rest. No more guessing about plant density, no more conversions or coefficients, just a few stems and a clear picture of your plant stand per acre.
How to Count Your Wheat Plants
To begin, select your method based off your drill pattern. If your rows is easy to predict, like standard drilled wheat, then row counting works well. If you’ve got narrow rows or if you broadcast seed with everything all over the place, frame counting is best. As long as you enter honest numbers, the tool won’t care which one you choose.
Because their biological clocks are different, the tool accounts for spring wheat vs. Winter wheat differences. In the former case, spring wheat has the whole growing season to compensate for a thinner start. With winter wheat, you need enough time to tiller before frost hits. That adjustment shifts notion of what makes a good stand.
The tricky part is counting number of live plants (because they look like a tiller). Count them, get your hands dirty, and separate real plants from the tillers that look like plants. Wheat’s insurance policy is called tillering: One seed can become many stems; then each stem can hold a head. Low plants does not necessarily equal a low yield. What matters is how many productive tiller emerge in the spring. That’s why the calculator asks for an estimate, so it has enough information to predict head density.
Late planting means the plants has less time to tiller. To make up for lost growth potential, you need more seeds per foot. Early planting allows you to use fewer seeds and let nature’s growth take over. Late planting requires buying more seed to plug gaps that time won’t fill.
No formula can precisely account for soil moisture or temperature. Even with perfect-quality seed, a cool, wet seedbed will slow emergence. Your seed-tag germination rate is a lab number, not a promise in the field. Usually, you’ll have some percent lost to poor seed-to-soil contact, crusts, or pests. To account for this, the calculator allows you to set the expected appearance in the field. This is your optimism-buffer zone.
One other thing: Know your seed size. Big seeds mean fewer pounds, but often better initial vigor. Small ones require more pounds to achieve an equal plant population. The table on the page, showing what’s typical of common seed lots, is your guide here. It explains how a lower germination rate demands increasing your seeding rate to maintain equal plant density.
And then there’s the hard part: making the call about replanting. Is it going to be worthwhile, to burn another tank of gas and buy more seed? This tool tells you what percentage of target stand you have. Sixty percent? Uh-oh. Eighty percent? Maybe you’ll get by.
It depends, and the pattern of where you are thin also matters, whether there are scattered gaps or if it is uniform across the field. Uniform thinness is easier to manage then scattered holes. And patches of okay-to-good look great overall, but they leave money on the table (literally!) where things got thin. Counting separately in those crusted-out strips and drowned out areas reveals the true story. Don’t hide bad acres behind the good ones.
Growing wheat is a science of compromise, of competition and density. If there are too many plants, they will compete with one another for nutrients and light. If there are not enough plants, weeds will fill the gaps. Knowing where you start is finding that sweet spot. And numbers help.
Are you planting enough heads per square foot to meet your yield goal? Or have you paid too much for seed you didn’t need? This isn’t precision because it’s perfect. It’s precision because you know what you’re doing.
You plant the seed. You count the stems. You trust the numbers more than your gut. You turn a hope into a harvest that way.