Sprayer Gallons Per Acre Calculator
Estimate actual GPA from a catch test, required nozzle flow for a target rate, boom output, tank coverage, acres per hour, and refill needs for field sprayers.
Use clean water for calibration math before adding products. Final spraying decisions must follow the pesticide or fertilizer label, PPE instructions, nozzle manufacturer guidance, local regulations, weather limits, buffer zones, and drift-management rules.
Sprayer GPA Estimate
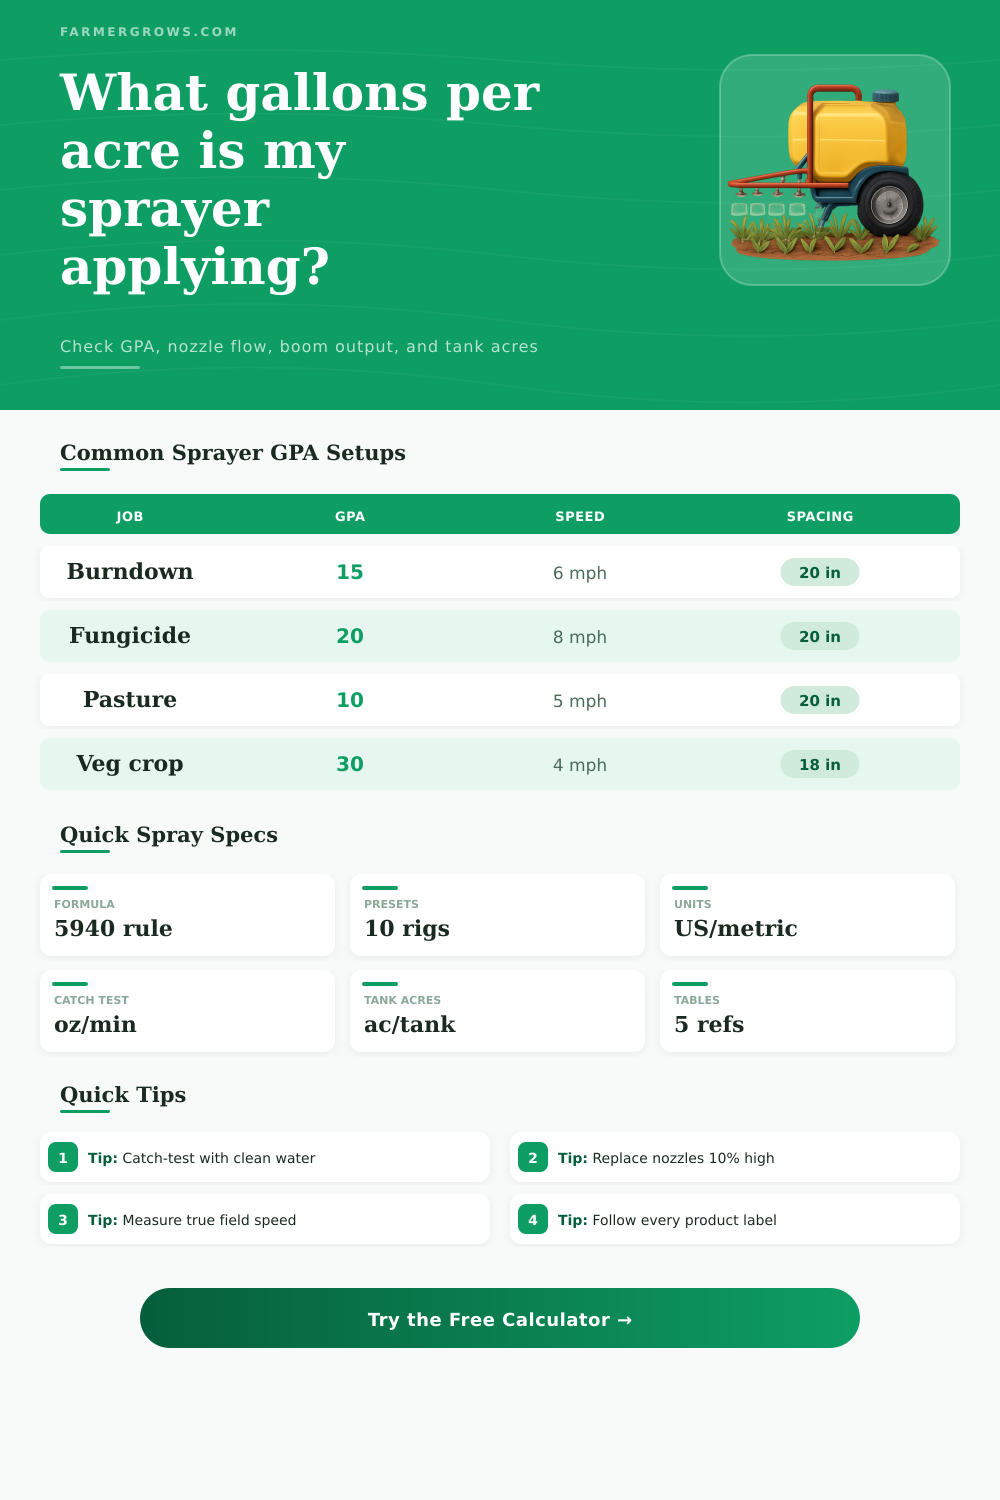
Results use the standard U.S. boom formula: GPA = 5940 x GPM per nozzle / (mph x nozzle spacing in inches).
| What to find | Formula | Units | Use it when |
|---|---|---|---|
| Actual GPA from nozzle flow | GPA = 5940 x GPM / (mph x spacing in) | GPM, mph, inches | You catch-test one nozzle and want applied gallons per acre. |
| Required nozzle GPM | GPM = GPA x mph x spacing in / 5940 | GPA, mph, inches | You know the label carrier rate and need the correct nozzle output. |
| Total boom flow | Boom GPM = GPM per nozzle x active nozzles | GPM | You are checking pump capacity, agitation margin, and plumbing load. |
| Metric application rate | L/ha = 600 x L/min / (km/h x spacing cm) | L/min, km/h, cm | You calibrate in metric units or compare to L/ha labels. |
| Acres per hour | ac/hr = mph x boom ft x field efficiency / 8.25 | mph, feet | You estimate workload, water supply, and refill timing. |
| Target setup | Required flow | Example GPA | Calibration note |
|---|---|---|---|
| 15 GPA, 5 mph, 20 in | 0.253 GPM/nozzle | 15.0 GPA | Close to an ISO 025 tip at 40 psi. |
| 15 GPA, 6 mph, 20 in | 0.303 GPM/nozzle | 15.0 GPA | Close to an ISO 03 tip at 40 psi. |
| 20 GPA, 6 mph, 20 in | 0.404 GPM/nozzle | 20.0 GPA | Often fungicide or dense canopy carrier volume. |
| 10 GPA, 8 mph, 20 in | 0.269 GPM/nozzle | 10.0 GPA | Low carrier broadacre work; drift control matters. |
| 30 GPA, 4 mph, 18 in | 0.364 GPM/nozzle | 30.0 GPA | Common for slower vegetable or small-plot coverage. |
| 12 GPA, 10 mph, 15 in | 0.303 GPM/nozzle | 12.0 GPA | Narrower spacing can keep flow moderate at high speed. |
| 30-sec catch | Flow per nozzle | GPA at 6 mph, 20 in | Interpretation |
|---|---|---|---|
| 12.8 fl oz | 0.200 GPM | 9.9 GPA | Light carrier rate; confirm coverage and label minimums. |
| 16.0 fl oz | 0.250 GPM | 12.4 GPA | Useful for lower-volume systemic products. |
| 19.2 fl oz | 0.300 GPM | 14.9 GPA | Near a 15 GPA broadacre setup. |
| 25.6 fl oz | 0.400 GPM | 19.8 GPA | Common higher coverage fungicide setup. |
| 32.0 fl oz | 0.500 GPM | 24.8 GPA | High carrier volume; verify pump and agitation margin. |
| 38.4 fl oz | 0.600 GPM | 29.7 GPA | Vegetable, orchard, or specialty carrier volume range. |
| Boom setup | Nozzles at 20 in | Boom flow at 0.30 GPM | Ac/hr at 6 mph, 80% efficiency |
|---|---|---|---|
| 30 ft utility boom | 18 nozzles | 5.4 GPM | 17.5 ac/hr |
| 45 ft small field boom | 27 nozzles | 8.1 GPM | 26.2 ac/hr |
| 60 ft pull-type boom | 36 nozzles | 10.8 GPM | 34.9 ac/hr |
| 80 ft self-propelled boom | 48 nozzles | 14.4 GPM | 46.5 ac/hr |
| 90 ft high-capacity boom | 54 nozzles | 16.2 GPM | 52.4 ac/hr |
| 120 ft large-acre boom | 72 nozzles | 21.6 GPM | 69.8 ac/hr |
| Application type | Typical carrier | Nozzle tendency | Important caution |
|---|---|---|---|
| Systemic broadleaf herbicide | 10 to 15 GPA | Medium to coarse droplets | Respect label drift language, wind speed, and boom height. |
| Contact herbicide | 15 to 20 GPA | Medium droplets | Coverage is more important; avoid too-coarse droplets unless labeled. |
| Fungicide or insecticide canopy | 15 to 30 GPA | Fine to medium, label dependent | Canopy penetration and coverage must be verified in the crop. |
| Pre-emergence soil residual | 15 to 25 GPA | Medium to coarse droplets | Uniform soil coverage matters; watch overlaps and skips. |
| Orchard or vineyard airblast | 50 to 150 GPA | Rig-specific | Calibrate each side and adapt to canopy density. |
| Liquid nitrogen streaming | 20 to 40 GPA | Streamer or fertilizer outlet | Account for fertilizer density, corrosion, and pressure limits. |
Catch every boom section: Check several nozzles across the boom, not only one clean tip. Replace any nozzle that is roughly 10% above or below the average, then retest before loading product.
Measure speed in the field: Wheel slip, soft soil, slope, and controller lag can make display speed different from real travel speed. Time a known distance with the sprayer configured as it will run.
When that sprayer rolls out, getting right gallons per acre matters more then most people realize. Not enough carrier and product might never get where you want it to go. Too much and you’re wasting tank capacity, fuel and time while also running a higher risk of producing runoff. Often times it show up in the field before it shows up on paper. That’s why taking an extra fifteen minutes for calibration before each major job is worth it.
But when you input numbers that define how you set up, the calculator above do the rest of the math. The calculator use travel speed, nozzle spacing, and measured output to determine basic relationship between flow rate and application rate. It doesn’t matter if you’re using a narrow orchard rig working between rows or a sixty-foot boom on flat ground; the relationship doesn’t change. And that’s why tool is valuable. It takes away mental arithmetic so you can concentrate on whether what you get matches what the label expects.
Why Calibration Matters for Sprayers
“The thing that surprises folks the most is speed input. Your console might say you’re going at 6 miles per hour, but a headwind on an open field or wheel slip on soft soil may reduce your actual ground speed by half a mile per hour or more. Even such a small error scales across each acre because it’s divided by speed in the formula. Spacing work similarly. Changing treated width is what really matters; even if you use same number of nozzles and the same volume, the actual rate changes. Keep math honest by measuring once with tape and checking label against treated width.”
There are other not-so-obvious variables such as nozzle wear. An output nozzle that has tipped over and produces ten percent more than its rated amount look just like others in boom, until you look at the rest of the boom. Enter your measured flow into calculator and it will quickly reveal how much more you applied. It’s often the answer to “why did this section of my field come out different than that section?”
The calculator The rate directly translates into tank coverage. If pump delivers a set number of gallons per acre, volume in your tank determines how many acres it can cover in one fill. This also tell you how many fills is needed to complete job. On large fields, knowing that figure comes in handy because traveling back to the fill station adds up. Also, although volume may be same, pump load could change if using denser liquids (e.g., liquid nitrogen) since they’re heavier and need a density correction. That’s why this option exist in the input.
But as they say, there is variables that no mathematical formula can take into account in real life. Factors like canopy density, wind changes, and temperature inversions will play a role. Will all affect how much actually hits target compared to planned rate. The calculator provide a solid starting point, but then you should of observe and fine-tune things as first pass is completed. It takes that baseline and makes it repeatable from season to season. It turns a guess into a repeatable process.