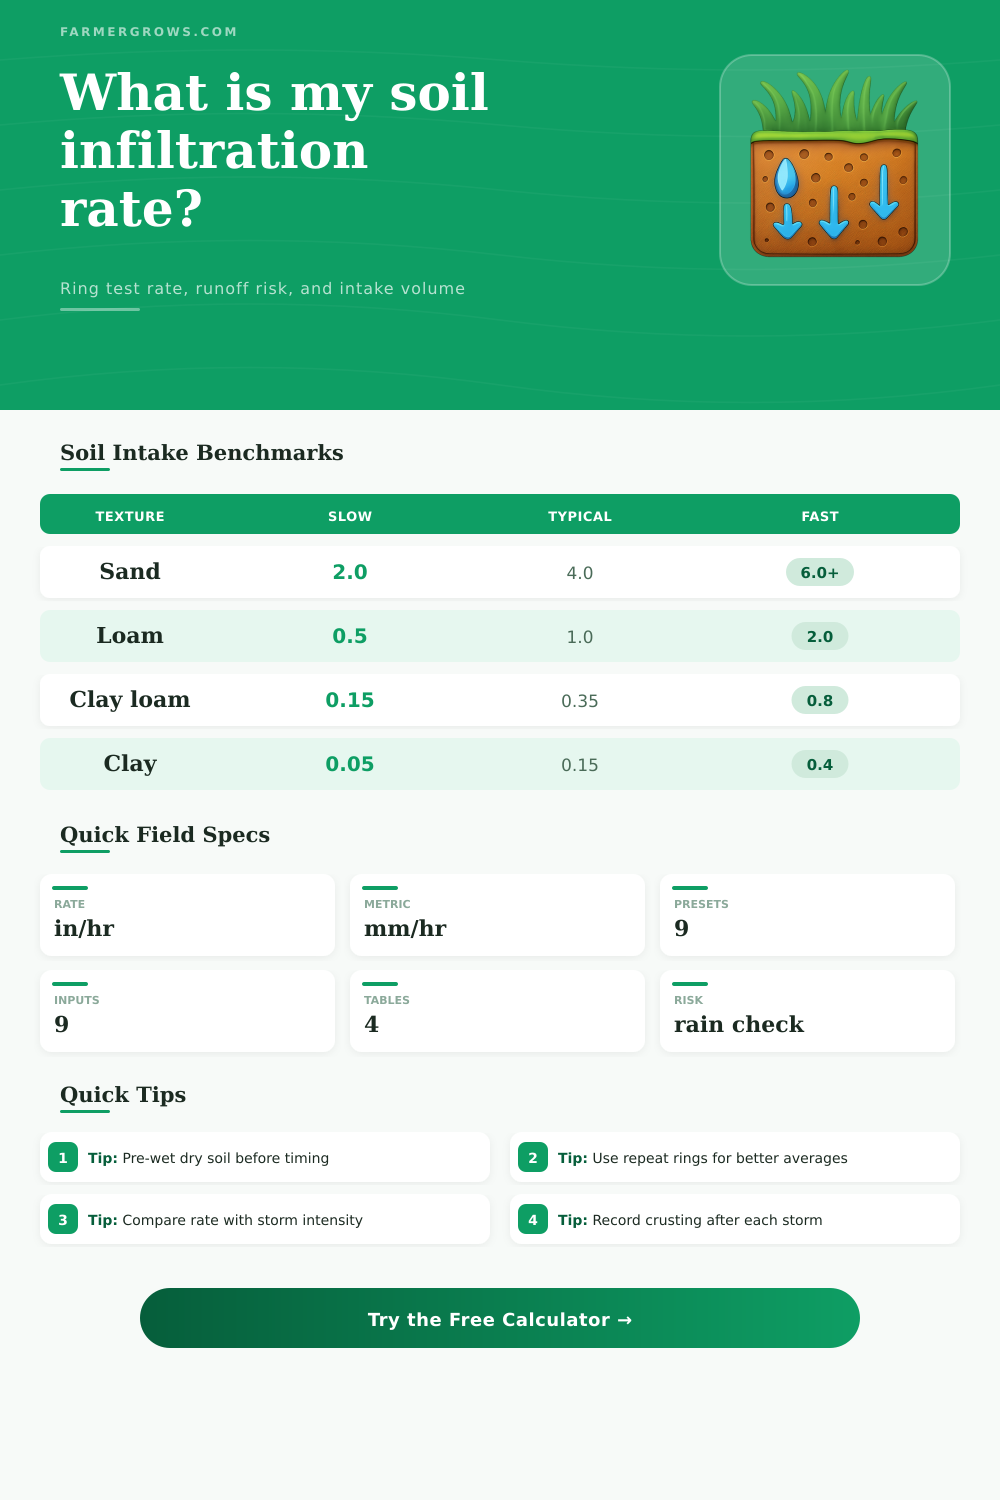
Soil Infiltration Rate Calculator
Turn a ring infiltrometer field reading into in/hr, mm/hr, field-adjusted intake, runoff risk, and water intake volume for beds, pastures, orchards, and cropped fields.
Use the measured water drop after the ring is seated and the soil has had a short pre-wet period. The base rate is water drop divided by elapsed time; the field-adjusted rate applies transparent texture, crusting, and slope modifiers.
Deep sands and gravels usually accept water quickly, often above 1.0 in/hr when not compacted.
Loams and sandy loams commonly support steady crop water entry when residue protects the surface.
Fine loams and clay loams need slower rainfall or irrigation sets to avoid surface runoff.
Heavy clay, shallow restrictive layers, crusting, or high water tables can keep intake below 0.2 in/hr.
Infiltration Estimate
The measured ring rate is drop depth divided by elapsed time. The adjusted intake applies texture, crusting, and slope modifiers before comparing rainfall intensity.
| Texture | Hydrologic group | Typical steady intake | Field meaning |
|---|---|---|---|
| Sand | A | 2.0 to 6.0+ in/hr | Rapid entry; irrigation uniformity can matter more than runoff. |
| Sandy loam | A/B | 1.0 to 3.0 in/hr | Usually good infiltration unless compacted or crusted. |
| Loam | B | 0.5 to 2.0 in/hr | Balanced intake for many gardens, pastures, and row-crop fields. |
| Silt loam | B/C | 0.25 to 1.0 in/hr | Can seal after intense rain, especially with low residue cover. |
| Clay loam | C | 0.15 to 0.8 in/hr | Watch set times, ponding, and traffic compaction. |
| Clay | D | 0.05 to 0.4 in/hr | Slow intake; runoff risk rises quickly under heavy rainfall. |
| Rain / intake ratio | Risk label | Likely field response | Practical check |
|---|---|---|---|
| 0.00 to 0.60 | Low | Most rainfall should enter if storage is available. | Check low spots and wheel tracks. |
| 0.61 to 0.90 | Moderate | Small surface runoff may start on sealed or sloped areas. | Shorten irrigation sets or increase residue. |
| 0.91 to 1.20 | High | Rainfall is near or above adjusted intake capacity. | Expect ponding during peak intensity. |
| Above 1.20 | Severe | Runoff is likely unless depressional storage is high. | Prioritize cover, contouring, or slower application. |
| Ring diameter | Area | Water for 1 inch drop | Water for 25 mm drop |
|---|---|---|---|
| 4 in / 10.2 cm | 12.6 in² | 0.054 gal | 0.20 L |
| 6 in / 15.2 cm | 28.3 in² | 0.122 gal | 0.46 L |
| 8 in / 20.3 cm | 50.3 in² | 0.218 gal | 0.83 L |
| 12 in / 30.5 cm | 113.1 in² | 0.490 gal | 1.86 L |
| Condition | Expected effect | Calculator input | Interpretation |
|---|---|---|---|
| Residue-covered loam | Stable pores and less sealing | Low crusting, 0 to 3% slope | Measured and adjusted rates should stay close. |
| Fresh tilled silt loam | Fast early, then sealing possible | Light to moderate crusting | Repeat after a storm to see if rate drops. |
| Wheel track or headland | Compaction reduces macropores | Lower measured drop rate | Compare with an undisturbed row middle. |
| Clay on slope | Slow intake and short ponding time | Clay texture, higher slope | Runoff risk can be high even with modest rain. |
Testing tip: For dry soil, add a pre-wet cycle, allow the surface to settle briefly, then time the next drop. That makes the reading closer to a steady infiltration rate.
Comparison tip: Run at least three rings across contrasting zones such as row middle, wheel track, headland, and residue-covered soil before changing irrigation or drainage plans.
Infiltration is the rate at which water enter the soil profile once it lands on the soil surface. The infiltration rate can differ between field. Additionally, the infiltration rate can change depending upon an amount of water that the soil can absorb.
The infiltration rate can be measured using a tool called an ring infiltrometer. A ring infiltrometer will allow you to measure the infiltration rate of the soil in your field right now. This method is more accurate than using a texture map to estimate infiltration rate; texture maps only provide information regarding what the soil should do rather than what the soil is actualy doing.
How to Measure and Use Soil Infiltration on the Farm
The ring test will require the purchase of a metal cylinder and a timer. You will seat the metal cylinder a few inch into the ground. You will add a measured depth of water to the metal cylinder.
The time it takes for the water level within the metal cylinder to drop is noted with a timer. A calculator will use this raw observation to calculate the infiltration rate in units of inches per hour. The calculator will make field adjustments to the infiltration rate.
Why? Because the infiltration rate measured within a small metal ring will not necessarily be the same as the infiltration rate of the entire field. The infiltration rate of a ring metal cylinder may be measured after it is installed in freshly wetted soil, yet the infiltration rate of the same field during periods of rainfall may occur upon a crusted field surface on a slope in the field.
In order to provide farmers with a helpful calculation, the calculator allows for the input of the soil texture class, crusting of the field, and the percentage of the slope of the fields land. Soil texture will play a primary role in the infiltration rate of the soil. Sandy soils will have a large number of pores within the soil that allow water to move quickly through the soil profile.
Clay soils will have tiny spaces between the soil particles that easily become filled or blocked by other soil particles. These two soil types are in the extreme range of infiltration rates. Loams and silt loams are soils that fall somewhere in the middle of sandy and clay soils.
The infiltration rate of loams and silt loams can change depending upon whether soil residue covers the soil or if the soil has been compacted by farm field traffic. These factor will influence infiltration. This information can be entered into the calculator.
Crusting of the soil will reduce infiltration rate. A light crust of soil will reduce infiltration rates. A severe crust will also reduce infiltration rates of the soil by half or more.
The infiltration rates as captured by the ring infiltrometer will be based upon the current state of the soils surface. However, the crusting setting within the calculator will allow the farmer to enter information about whether the soils surface is open or if it features a soil crust. Field slope will impact infiltration rates of the soil.
The steeper the slope of the land in the field, the less time that the water will remain in one spot within the field. This lack of retention of water within one spot will increase the risk of runoff. The calculator will provide a downward correction to the infiltration rate according to the slope of the field.
The rainfall intensity within the calculator will allow for the comparison of infiltration rates to the rates at which it will rain in the field. If the rainfall rate divided by the infiltration rate of the soil is below one, then most of the rainfall will enter the soil provided that the soil has enough capacity to hold the water volume that will fall on the field during the selected period. If the rainfall rate divided by the infiltration rate is above one, then ponding of rainfall within the field will occur, as will runoff of the fields surface.
This information will provide information to farmers as to whether or not irrigation is required, or if cover crops should be planted in the field to increase infiltration of the land. The calculator will provide the volume of water that will infiltrate into the field according to the infiltration rate. This information can help farmers to understand how long it will take for an irrigation system to run without causing the water to run off of the field.
Using these volume outputs, farmers can begin to understand the different zone within the field. For instance, a headland in the field may have been driven upon by several irrigation passes with farming implement tires. The volume of infiltration will be lower in that portion of the field relative to the “row middles” of that field.
The difference in infiltration volume can help inform farmers of the cost of soil compaction within their field. In order to produce accurate measurements of infiltration rates of fields, there are a few factor to consider. First, the diameter of the metal ring can impact the infiltration rate; the infiltration rate of a small metal ring may differ from the infiltration rate of a large metal ring when used on sandy soils.
Additionally, the test should be performed several times in a field, and the infiltration rates should be averaged to ensure accuracy of the measurement. The calculator provides the infiltration rate according to the repeat count of the infiltration test. Fields are not uniform in their soil composition.
Field variations can include restrictive soil layers deep within the soil profile, drainage into gravel in certain areas of the field, soil compaction due to farm field traffic, and the variable presence of residue on the soils surface. Because the ring test cannot account for all of the variation that may exist in a field, it is best to test the soil in several spots within a field to ensure that the result of only one test does not represent the entire farm. Additionally, the test should be performed each time there are changes in the environment of the field.
Fields with high infiltration rates may become less infiltrative after exposure to heavy traffic with farming implement tires or rainfall events that create crusts on the fields surface. Repeating this test will allow farmers to compare infiltration rates of the same field. Finally, infiltration rate is just one aspect of managing water within fields.
Other aspects to consider include the storage capacity of the soil, restrictive layers within the soil, and rainfall rates. Fields with high infiltration rates may have high storage capacity for water. However, if the water table within the soil is high, the soil may run out of room to store the water that falls on the field.
Additionally, the infiltration rate of the soil can be measured using the ring test. However, the ring test does not measure the movement of that infiltrative water through the soil. The infiltration rate of the soil can be used to make decisions regarding the farms irrigation system and management of crop growth within the fields.
For instance, if irrigation systems are installed within fields, it may be beneficial to shorten the period of time in which the irrigation system remains active in fields where infiltration rates are low. Alternatively, if the infiltration rate is low due to soil crusting, it may be beneficial to add cover crops to the field to help provide infiltration of water into the soil. Additionally, if infiltration rates are low along field tracks where farm equipment moves, it may be beneficial to change the way that farm implements move through the fields to minimize the impact of soil compaction on infiltration rates of water into the soil.
Thus, using the infiltration rate as a decision-making tool for farmers is more beneficial then using decision-making tools based on texture maps alone.