Rice Plants Per Acre Calculator
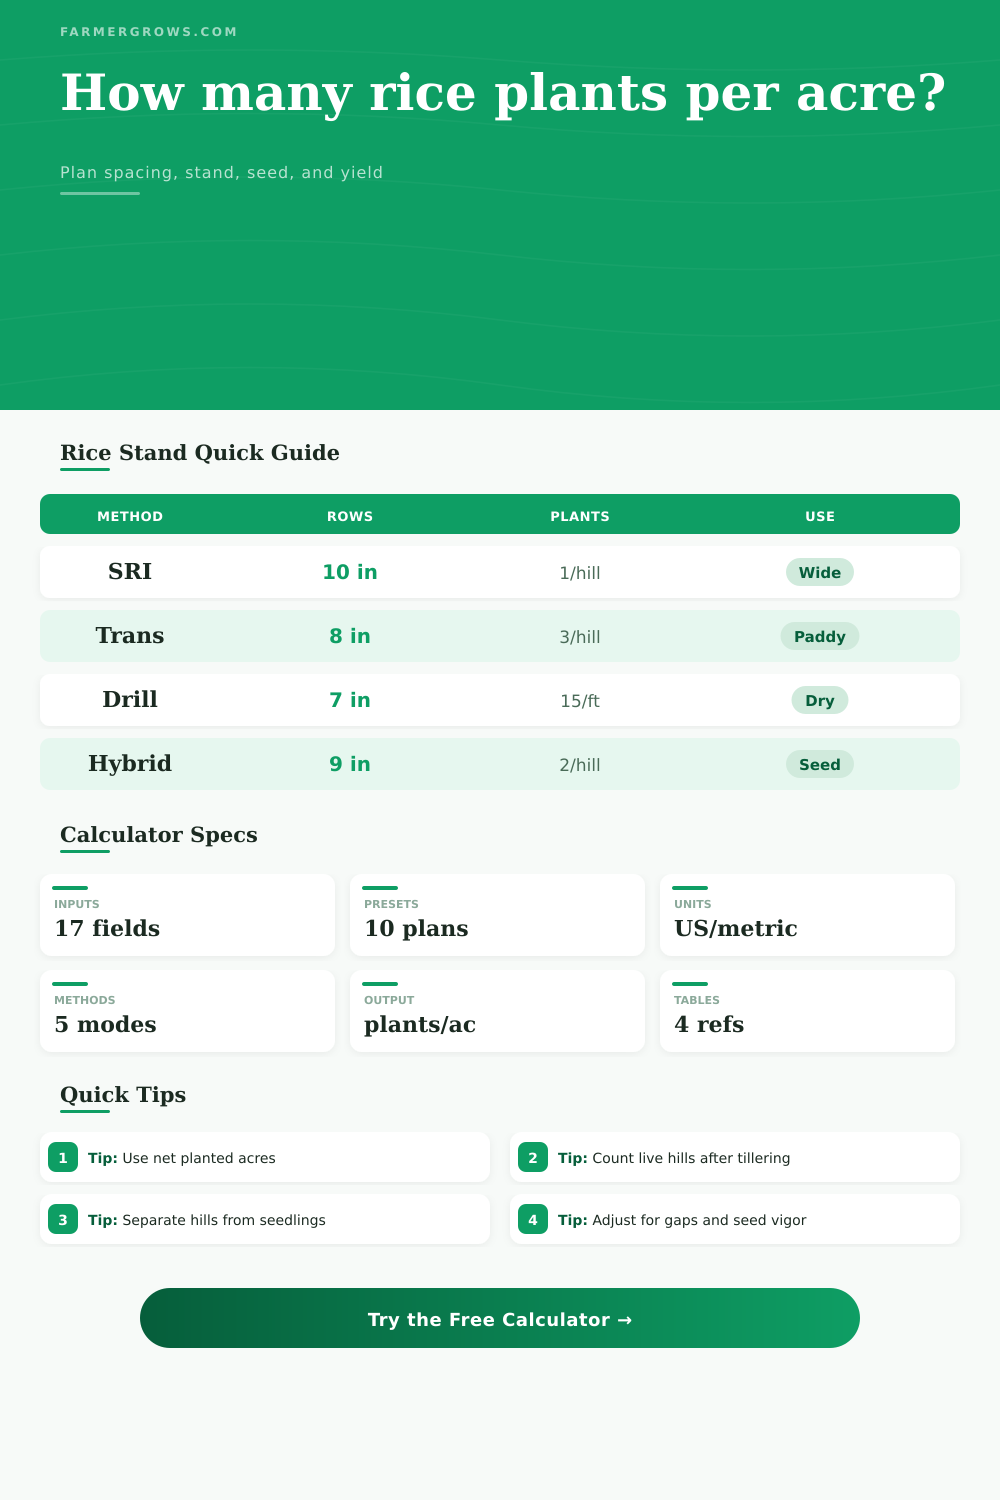
Estimate rice plants per acre from field area, row spacing, in-row spacing, seedlings per hill, emergence, gaps, tillering, seed rate, and expected panicle stand.
Use net planted area for rice paddies, strips, terraces, or drill-seeded fields. The calculator keeps hills, seedlings, established plants, tillers, and harvestable panicles separate so dense transplanting and direct seeding do not get mixed together.
Rice Plant Population Results
Enter rice spacing and stand details to calculate the acre population.
| Spacing pattern | Hills per acre | 1 seedling at 90% | 3 seedlings at 85% | Common fit |
|---|---|---|---|---|
| 6 x 6 inches | 174,240 | 156,816 plants/ac | 444,312 plants/ac | Very dense transplanting |
| 8 x 8 inches | 98,010 | 88,209 plants/ac | 249,926 plants/ac | Common line transplant |
| 10 x 10 inches | 62,727 | 56,455 plants/ac | 159,955 plants/ac | SRI or wider hybrid spacing |
| 12 x 12 inches | 43,560 | 39,204 plants/ac | 111,078 plants/ac | Wide square spacing |
| 20 x 15 cm | 134,871 | 121,384 plants/ac | 343,921 plants/ac | Metric line transplant |
| Direct seed rows | Row feet per acre | 10 plants/ft | 15 plants/ft | 20 plants/ft |
|---|---|---|---|---|
| 5 inch rows | 104,544 ft | 1,045,440 plants/ac | 1,568,160 plants/ac | 2,090,880 plants/ac |
| 6 inch rows | 87,120 ft | 871,200 plants/ac | 1,306,800 plants/ac | 1,742,400 plants/ac |
| 7 inch rows | 74,674 ft | 746,743 plants/ac | 1,120,114 plants/ac | 1,493,486 plants/ac |
| 8 inch rows | 65,340 ft | 653,400 plants/ac | 980,100 plants/ac | 1,306,800 plants/ac |
| 10 inch rows | 52,272 ft | 522,720 plants/ac | 784,080 plants/ac | 1,045,440 plants/ac |
| Seed rate | 18k seeds/lb | 85% emergence | Plants per sq ft | Best used for |
|---|---|---|---|---|
| 40 lb/ac | 720,000 seeds | 612,000 seedlings | 14.0 plants/sq ft | Hybrid or precision drill |
| 60 lb/ac | 1,080,000 seeds | 918,000 seedlings | 21.1 plants/sq ft | Moderate drill seeding |
| 80 lb/ac | 1,440,000 seeds | 1,224,000 seedlings | 28.1 plants/sq ft | Common dry-seeded plan |
| 100 lb/ac | 1,800,000 seeds | 1,530,000 seedlings | 35.1 plants/sq ft | Broadcast or stale seedbed |
| 120 lb/ac | 2,160,000 seeds | 1,836,000 seedlings | 42.1 plants/sq ft | High loss conditions |
| Stand cue | Plants per sq ft | Plants per acre | Likely note |
|---|---|---|---|
| Sparse transplant | 1 to 3 | 43,560 to 130,680 | Relies heavily on tillering |
| Common transplant | 4 to 8 | 174,240 to 348,480 | Check hill count and gaps |
| Moderate direct seed | 15 to 25 | 653,400 to 1,089,000 | Often enough for drill rows |
| Dense direct seed | 30 to 45 | 1,306,800 to 1,960,200 | Watch lodging and disease risk |
For transplanting: Count hills separately from seedlings. A field can have enough hills but still miss the plant target if seedling survival or early gap filling is poor.
For direct seeding: Compare the seed-rate estimate with the observed sample stand. Seed size, water depth, birds, crusting, and herbicide stress can all change emergence.
A successful crop, or one that falls short, starts with plant stands: How many rice plants is there alive in the ground? What happens when plants are spaced too close together and lack enough space to make up for low numbers by the time panicles begins to form?
Even the finest seed (hybrid) combined with timely fertilization doesn’t help much if the plants are spread too thin. Too dense, however, means no room for air, inviting lodging and disease, the stand sinks into itself.
How to Plan Your Rice Plant Spacing
It is more than just “feeling around” in the mud or looking at last year’s weather. We need a detailed view of expected plant loss and seedlings per square foot to plan the right stand density for each acre.
Spacing makes sense to most growers, but doing the math; transforming inches separating each hill, or each row of hills, into a headcount; are tricky. By entering your preferred distance between seeds or seedlings (your “spacing”), this calculator does the math for you, no more guesstimating how many hills or seedling are required.
It also takes into account the nature of how they’ll establish: Will you dry-drill them in a continuous row, or space out emerging seedlings with a line-transplanting approach?
That’s why we include a reference table showing that doubling spacing from 8 by 8 inches to 10 by 10 inches cuts down on the overall number of planting stations; a missed hill equals bigger losses than just one seed not coming up. It’s worth knowing about establishment rates and other gaps from the get-go.
You don’t have 100 percent germination with seed, nor do all hills makes it through initial week of herbicide stress or flooding. So if you plan based off 100 percent survival, you’ll be overestimating what field looks like when it gets to tillering. Adjusting for a reasonable rate (say 88 percent) gives you a more accurate snapshot of how many plants are in the field.
This is especially true when using single seedling per hill method popular with the System of Rice Intensification. One seed has to make it, then grow well, to keep up population density.
With wider spacing, does it leave sufficient number of plants to reach canopy cover? Or will there be lots of open ground to invite weeds? The calculator show you that.
Another factor frequently neglected in the rush to space out plants is seed rate. Planting in the ideal pattern doesn’t matter so much if your germination is poor or seed vigor are lacking, meaning you end up with fewer plants then you thought you’d get. With the tool, you can estimate how many plants you’ll get based on your intended seed rate. That way you know whether you’re over-seeding (wasting seed) or under-seeding (losing potential yield).
For direct seeding systems like mine, it’s good to be pushing the limit with population, often very high populations is needed to out-compete weed competition early. But you don’t want to just push for max density without accounting for the row width, which could result in such a dense, humid canopy as to invite blast disease. You want the right combination of full field coverage while maximizing each plant’s health.
Each variety has different tiller ability depending on growing conditions. Having an idea of how many productive tillers are in each plant helps refine yield expectations.
Adding realistic assumptions about losses and accurate spacing takes you from hoping to get a decent crop to planning to get a certain crop. That’s turning what was a vague ag hope into a measurable plan. That means every row and every hill is working they’re hardest to put grain on the ground.