
As most gardeners do, I approach my plot as if it’s a blank canvas, planting seeds here, hoping it will all turn out well over there. Plant the beans, water them, plant the tomato (and hope for a good outcome). The problem: A good outcome is often merely a way of describing the variables you haven’t paid attention to yet. To repeat success next time, you have to get past memory to record data instead.
Why did my zucchini succeed when my peppers failed? That sort of knowledge brings a kind of peace that comes from gardening. It also transforms guesswork into strategy.
How to Keep a Good Garden Log
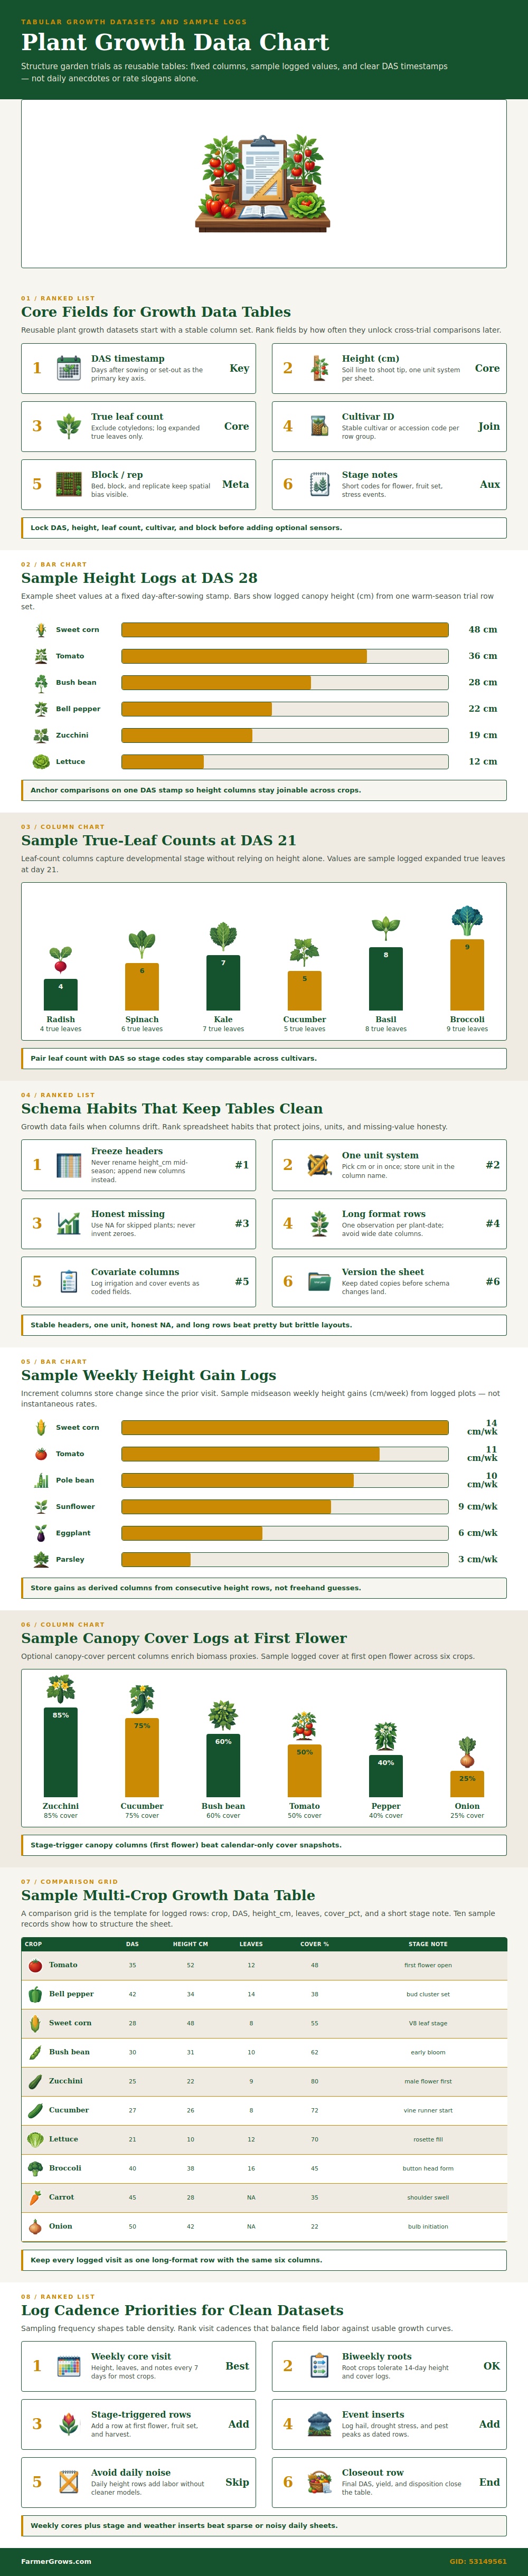
Structure is key in creating a useful growth log. If your column headers changes each week, how will you ever know what to compare? My breakdown (above) highlights core fields that should stay consistant throughout, such as true leaf count, height, and days after sowing. Do this early on, lock them down, and save yourself headaches when it comes time to compare your current crop to last year’s. That’s the difference between a scientific record and a journal entry. It is lovely, but is it useful?
The day number matter more than the calendar date. Timing is everything, and the number of days after sowing matters. A tomato planted in June will not behave like a tomato planted in April, even though both may be the same cultivar. When you anchor your data to what day the seed went in the ground, you’re normalizing the growth curve.
Looking at that list, you’ll know that on day twenty-eight, maybe sweet corn will reach forty-eight centimeters tall, and a bush bean will lag behind with only twenty-eight centimeters. No big deal; it isn’t a failed bean. It is just biology. It puts the growth rate into context. This helps you stop panicking when one plant seems to have slowed down because you can look at the two plants’ numbers next to each other.
And then there’s the one we always forget: Leaf count. Wind can knock down plants and soil levels change, so height is no longer a reliable measure. But true leaf count? That’s a pretty good indication of what phase of development the plant is in. Got 6 leaves on your spinach, and 7 leaves on your kale? You know just how far along they are, and thus when to thin them out or fertilize or whatever else. It is a little thing, sure, but it is important.
Another area of debate is how frequently to log things. Logging daily sounds comprehensive but most days are just noise not signal. Most plants does not progress measurably on any given day in a way that alters how you farm. Weekly visits to the core are the sweet spot; they show the trend without getting bogged down in administrative fatigue. Add supplemental rows for major events (heavy rain or first flower) as needed but keep the base line constant so you can more easily see what’s happening.
The data matters. But so does how you care for it, spreadsheet hygiene. Freeze your header row. Stick with a single unit of measure and do not switch between inches and centimeters midseason. Use “NA” when something is missing instead of putting in zeroes or leaving cells empty. Zero equals dead (the plant is lying down on the ground). NA equals you forgot to do that day. Keep your individual pieces honest, and all data will be honest too.
Last, think about how you will close out your experiment. How are you going to record final days, when seeds were sown; when something is disposed of or yielded? This completes the circle of the experiment. Next spring, looking back, it’s not simply that the tomatoes turned out fine. You can remember that they reached V8 leaf stage at day twenty-eight, and had fifty-five-percent canopy cover. Details like that make it possible for you to repeat success.
Gardening becomes less about hoping and more of a craft that you know how to do again; and again. You should of recorded everything accurately. It is naturaly better when you have the facts.