Pineapple Plants Per Acre Calculator
Estimate pineapple plants per acre, total planting pieces, extras for culls and gaps, row length, plant crop yield, and ratoon crop yield from spacing, bed pattern, planted area, and stand assumptions.
Use net planted area for pineapple fields by excluding lanes, drains, irrigation mains, turning space, headlands, and non-crop corners. Plant count is based on planting stations, whether you use slips, suckers, crowns, tissue-culture starts, or mixed planting material.
Pineapple Plant Population Results
Enter spacing and area to calculate pineapple plant density.
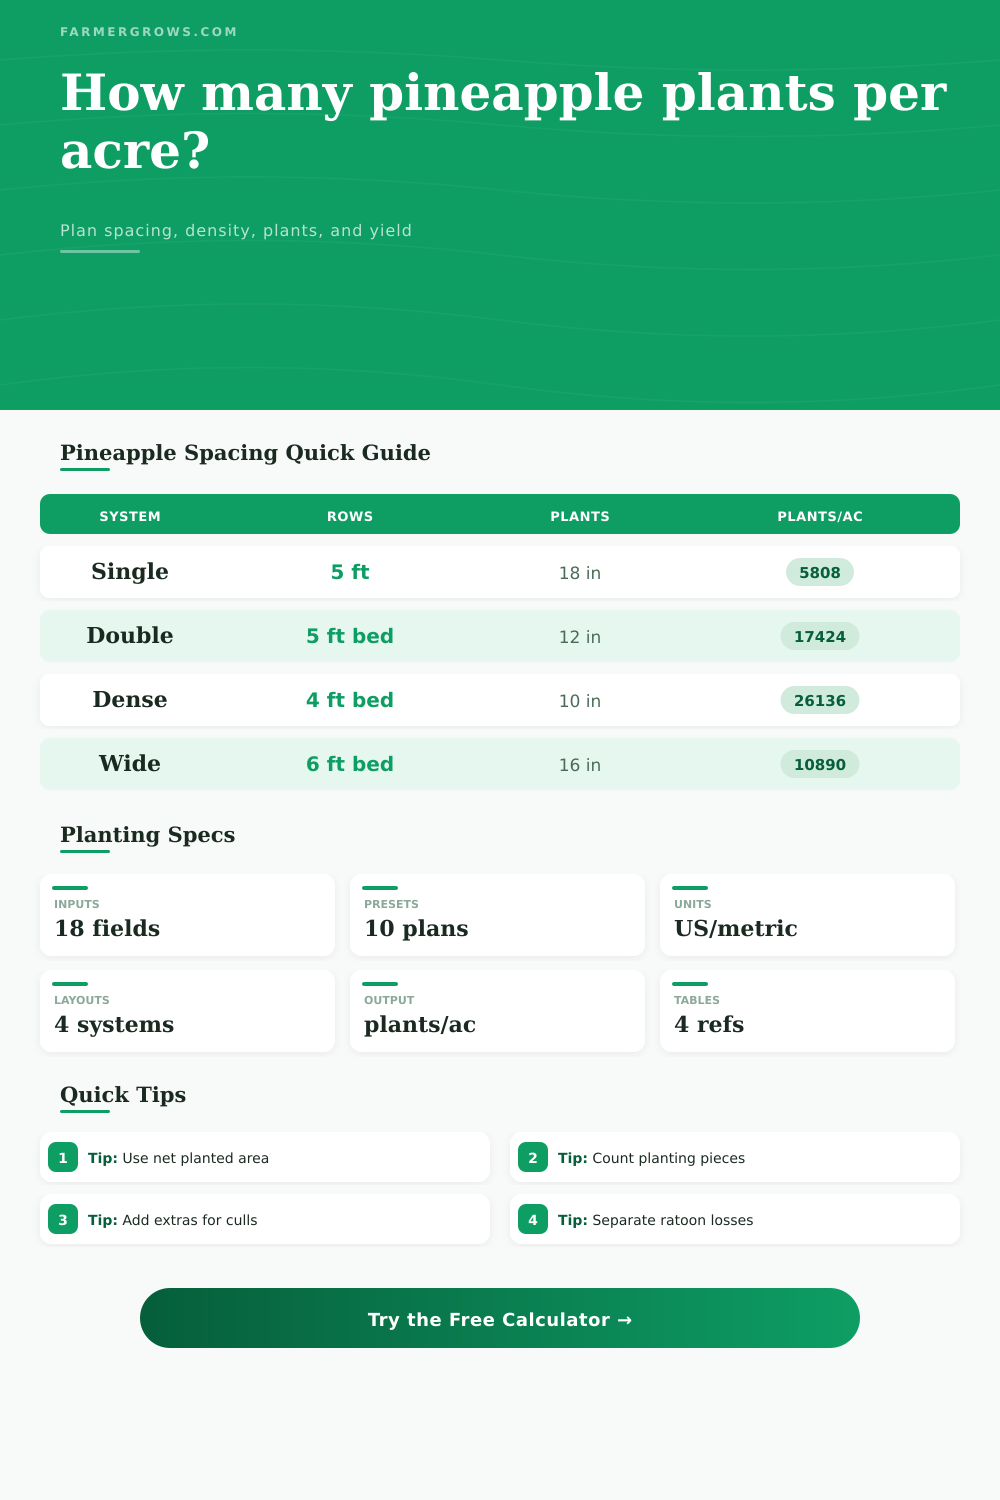
| Layout | Row or bed spacing | In-row spacing | Net plants per acre |
|---|---|---|---|
| Single row grid | 5 ft rows | 18 in | 5,808 plants |
| Double row bed | 5 ft bed centers | 12 in | 17,424 plants |
| Double row bed | 4.5 ft bed centers | 12 in | 19,360 plants |
| Dense double row | 4 ft bed centers | 10 in | 26,136 plants |
| Wide organic bed | 6 ft bed centers | 16 in | 10,890 plants |
| Triangular single row | 4 ft rows | 14 in | 10,773 plants |
| Net field plants | 90% survival | 6% culls | 8% buffer | Prepare about |
|---|---|---|---|---|
| 5,000 | 5,556 | 5,910 | 473 | 6,533 pieces |
| 10,000 | 11,112 | 11,821 | 946 | 13,067 pieces |
| 15,000 | 16,667 | 17,731 | 1,419 | 19,600 pieces |
| 20,000 | 22,223 | 23,641 | 1,892 | 26,134 pieces |
| 25,000 | 27,778 | 29,551 | 2,365 | 32,667 pieces |
| Fruit plan | Avg fruit weight | Harvestable stand | Approx yield per 10,000 plants |
|---|---|---|---|
| Fresh market medium | 3.5 lb | 88% | 30,800 lb |
| Large fresh fruit | 4.2 lb | 84% | 35,280 lb |
| Processing fruit | 3.0 lb | 90% | 27,000 lb |
| Organic mixed sizes | 3.2 lb | 82% | 26,240 lb |
| Ratoon crop check | 85% of plant crop | 70-80% | Often lower |
| Block example | Gross area | Usable area | Spacing pattern | Approx stations |
|---|---|---|---|---|
| Small trial patch | 0.25 acre | 85% | 5 ft bed, 12 in, 2 rows | 3,703 plants |
| One-acre fresh block | 1 acre | 88% | 5 ft bed, 12 in, 2 rows | 15,333 plants |
| Dense processing acre | 1 acre | 90% | 4 ft bed, 10 in, 2 rows | 23,522 plants |
| Organic airflow acre | 1 acre | 80% | 6 ft bed, 16 in, 2 rows | 8,712 plants |
| Metric half hectare | 0.5 ha | 88% | 1.5 m bed, 30 cm, 2 rows | 23,680 plants |
For plant counts: Count one pineapple planting piece per station. Do not add slips produced later unless you are planning nursery propagation separately.
For order planning: Sort planting material by size before setting final field numbers. Cull rate, rooting survival, and gap fill can change the number of pieces to prepare.
Setting up a pineapple field means placing thousands of plant in evenly spaced, straight rows. Before harvest time, you must gets the row spacing correct. To do this, you have to work backwards from what you expect to harvest. Typically, farmers guess at the spacing and then compute how many plants they’ll grow. That’s a poor way to go about it.
The calculator below does the geometry for you. It will convert your field size into projected yield and number of plant.
How to Plan Your Pineapple Field
Here are the variables that matter. The biggest piece here is starting plant: What type do you want to start with (tissue-culture, crown, slip, sucker)? Each one behaves differently in the field. Are you looking for something that grows quickly? Uniform tissue-culture plants would be good. Looking for a hardy, robust plant? Try suckers. Are you looking for something that requires more careful handling? Tissue-culture plants requires more careful handling. Avoid the high waste and varied size of suckers and go with either slips or crowns.
The system will adjust how many plant you need to buy based off the biology. For example, if you choose tissue culture, it will assume there’s a higher likelihood of success. So maybe you don’t need as many extras. This is a little tweak that can help you avoid ordering too much, or not having enough, that week.
The trade-off is obvious in the spacing: Easy-to-manage single rows spaced widely waste the land’s potential. Industry-standard double-row beds on raised mounds increases air circulation and drainage. They also pack maximum density. Toggle the calculator’s options between single-, double- or triangular-rows. Triangles fit about fifteen percent more plants per unit of space compared to a square grid. That added density may make the difference between marginally profitable crops and a solid return. But the denser the crop, the greater the chance of nutrient competition and disease. How much to add will be a balancing act between farming pressures from tight spacing and the gain in density.
Don’t neglect the unplanted space. A field isn’t a perfectly rectangular plot of planted crops. There are turning spaces, headlands, drains and irrigation mains to contend with. Calculate your plant order based on one acre, but if only eighty-eight percent of your land is usable then you’ll come up short. The tool asks what percentage of the land is usable so you can enter these losses and subtract them from the total before final plant count. This helps avoid common mistake of buying too many plants based on a full acre. In reality, all of the plants must fit into actual planting zone. It is a simple fix that brings your budget back down to earth.
It’s all about experience. Experience affects how many plants establishes and how many are culled. Ninety-five percent? That is what new growers think they’ll achieve. But reality is typicaly cruel. Transplant shock, early root failure, and physical damage at planting time all take their toll. The calculator has fields for establishing percentage and adds a buffer for filling gaps. Add an additional five to ten percent to the order. You’ll have some spares on nursery bench. Better to spend money now than leave holes in the crop stand, which will never produce any fruit.
The page has some reference tables showing how those percentages compound. Those tell you a clear picture of what you can expect to end up with come harvest time.
The last component to the puzzle is yield planning. This includes projecting how many stands will be harvested. It also projects how much fruit weight is expected from first plant crop and the following ratoon crop. Because the fruit on the ratoon tends to be reduced in size and yield, the system applies a reduction factor. Being able to see these next to each other gives you an understanding of how valuable your field is over the long term. It’s not that you’re only planning for one harvest. You’re investing in a multi-year cycle.
So when you’re precision planting, it’s all about setting expectations. Market goals, start there. Soil conditions, check that. Now, let the math gets done by the calculator. Then tweak it according to real-world facts of your farm.
Half the battle is planning out the field well. The other half? It’s just good stewardship and a little patience.