Manure Per Acre Calculator
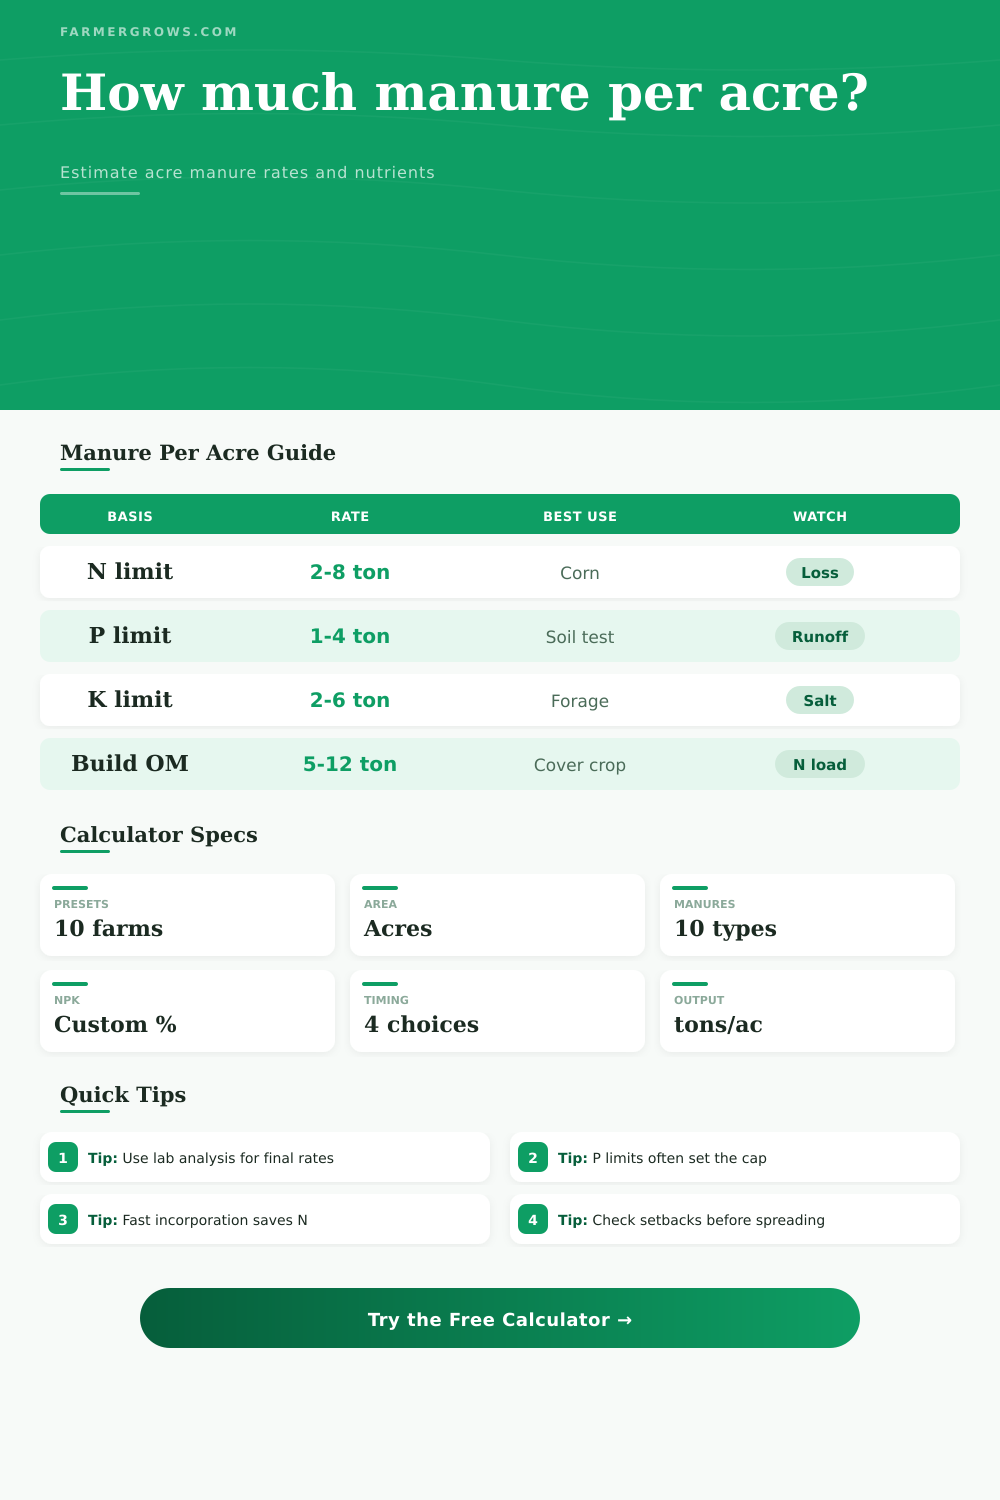
Estimate field manure rates from acres, manure analysis, moisture, N-P2O5-K2O targets, first-year availability, incorporation timing, crop removal, and the nutrient basis that limits application.
Choose a real field scenario, then adjust the analysis, moisture, nutrient targets, availability, and acres to match your manure test and crop plan.
Manure Nutrient Results
Application plan summary will appear here.
Moderate N, P, and K with high moisture. Often used before corn or forage where incorporation is possible.
Usually higher dry matter than dairy manure. Watch salts and uneven bedding content when spreading heavy rates.
High N and P2O5 per ton. Phosphorus often becomes the application limit before nitrogen is met.
Dense nutrient source with strong phosphorus value. Use soil test P and setbacks when planning acreage.
Often concentrated like poultry litter, with useful first-year N when incorporated quickly after spreading.
Composted material is easier to handle than slurry but still needs a current analysis for nutrient planning.
Bedding dilutes nutrients and adds carbon. Composting improves spreadability and reduces weed seed risk.
Dry pellets can be richer than cattle manure and spread well, but field-scale supply may be limited.
| Manure type | Typical moisture | Total N-P2O5-K2O | Planning note |
|---|---|---|---|
| Dairy cattle solid | 65% to 80% | 0.45-0.30-0.40% | Good fit for corn, silage, and forage acres |
| Beef feedlot manure | 40% to 65% | 0.70-0.45-0.60% | Dryer material can raise salts at heavy rates |
| Broiler litter | 20% to 35% | 3.00-2.80-2.40% | Often limited by phosphorus before nitrogen |
| Horse stable manure | 55% to 75% | 0.55-0.25-0.45% | Bedding lowers nutrient density and ties up N |
| Cattle compost | 35% to 55% | 1.00-0.70-0.90% | Stable soil-building material with slower N release |
| Incorporation timing | N timing factor | Best field fit | Management note |
|---|---|---|---|
| Incorporated same day | 95% of available N | Preplant corn, vegetables, annual forage | Best option for conserving ammonium nitrogen |
| Incorporated within 3 days | 82% of available N | Large acreage with delayed tillage | Loss risk rises in warm, windy conditions |
| Surface applied | 65% of available N | Established hay, pasture, no-till fields | Use weather windows to reduce volatilization |
| Fall or dormant application | 55% of available N | Cover crop or storage-pressure spreading | Leaching risk depends on soil and rainfall |
| Crop or rotation | N removal or uptake | P2O5 removal | K2O removal |
|---|---|---|---|
| Corn grain, high yield | 150 lb/ac | 60 lb/ac | 45 lb/ac |
| Corn silage | 180 lb/ac | 75 lb/ac | 180 lb/ac |
| Soybeans | 220 lb/ac | 70 lb/ac | 115 lb/ac |
| Grass hay | 140 lb/ac | 55 lb/ac | 170 lb/ac |
| Mixed vegetables | 120 lb/ac | 55 lb/ac | 130 lb/ac |
| Limit basis | Use when | Strength | Risk if ignored |
|---|---|---|---|
| N target limit | Crop needs N and soil test P is not high | Matches first-year crop demand | Can overapply P on poultry litter |
| P2O5 target limit | Soil test P, setbacks, or nutrient plan controls | Reduces runoff loading risk | May require supplemental nitrogen |
| K2O target limit | Forage, hay, or low-potash soil | Balances potassium removal | Can overapply N or P with some manures |
| Most restrictive | Manure nutrients are being capped carefully | Uses the lowest N, P, or K rate | May undersupply one or more nutrients |
Use the manure analysis on the same basis as the calculator. If the lab report is dry matter, choose dry matter basis so moisture converts the analysis to an as-applied wet-ton rate.
Use the most sensitive nutrient to set the cap. On poultry litter and high-phosphorus fields, a P2O5 limit may protect water quality even when nitrogen needs are not fully met.
Be thoughtful about when you apply manures. If you do not spread manure evenly, you risk damaging crops and causing nutrients to run off in nearby waters. You might get away with guessing for a season or two but sooner or later, soil tests will show you the consequences.
Knowing what restricts your application amount makes all the difference between success and facing regulators. Nitrogen is frequently cited by farmers as their limiting factor, since it’s so costly, but more often phosphorus are that nutrient.
How to Use Manure Right
Before you spread it, know what it is. Does this mean poultry litter? Beef feedlot waste? Or maybe dairy manure? They’re all different.
Poultry litter is very concentrated in nutrients and heavy (small amounts contains high levels of phosphorus and nitrogen). Dairy manure is less concentrated and more diluted; therefore, you has to haul much more to get the same level of phosphorus and nitrogen.
Once you put in your analysis, the calculator takes care of those conversions for you. No more having to convert dry matter percentages into pounds or wet tons yourself. That’s where most folks mess up. Your lab report show the numbers on a dry basis. You’re hauling a wet product. If you don’t account for that moisture, then your application rate will be far off.
But again: timing is a silent killer of efficiency. If you apply your manure as a top-dress, much of the N turns into gas in atmosphere and isn’t available to be picked up by plants when they need it. Applying right now saves that N by incorporating it right away. Applying in three days will lose some. Applying next winter will lose even more. This is why tool adjusts for available N based off whether you applied it today or left it on the snow to plant later.
This difference is key because N is volatile, while P and K are not and stay in soil building up over time. Which is part of what creates phosphorus limits. Deciding which nutrient (nitrogen or phosphorus) should be your limiting factor is a strategy. Do you want to apply too much of one nutrient, say phosphorus, to soil with plenty of it already? That is a liability. Or do you want to ensure good water quality by limiting phosphorus? If so, you must know that your corn will be hungry for extra nitrogen and you’ll have to purchase some.
No free lunch. Every choice is a tradeoff between dollars spent and potential environmental impact. The calculator helps you see this tradeoff, with numbers showing how each scenario plays out.
Perhaps you determine your fields would benefit from more potassium than they’re getting, but not so much of either nitrogen or phosphorus. Whatever your field is crying out for most, it’s up to you.
What you want to do is calculate how much of the crop will be removed. How much Nitrogen does corn use? How about potassium? What about hay? How about soybeans? Do they take phosphorus out of the ground? Or only potassium? What about nitrogen; do they makes it themselves?
The way you know is you use the reference tables on the page. They show you what each crop takes out of the ground based off typical rotations. So it give you an estimate at least for where you are starting. Then compare that with how much nutrient is in your manure. That way you can figure out whether you’re really building soil health, or wasting money and potentially reducing yield by under-applying or over-applying.
The world outside also imposes its own constraints. If there are 30 tons of dairy manure per acre and the ground’s too sodden, or your tractor can’t pull it, you’re not going to spread it. Maximum practical rates is also checked in the tool. It will remind you: even if the nitrogen math calculates that you must apply ten tons, your equipment may limit you to five. Work with what your land allows; work with what your machines allow.
Finally, managing manure is a matter of being precise. You don’t want to put back any more than the crop removed; you just want to replace it. There’s an economic, an environmental and a farming side to this. Let the tool help you find the right mix (i.e., balance) and make adjustments based off real-world situations. Your experience will tell you where to go; the numbers provide a target.
You can turn waste into something valuable if you get it right.