Head of Cattle Per Acre Calculator
Estimate how many head of cattle an acre can carry from forage dry matter, utilization, animal class, live weight, intake, grazing days, trampling loss, and drought reserve.
Start with a real herd and pasture situation, then adjust the cattle size, acres, forage, utilization, and grazing season to fit your place.
Stocking Rate Results
Calculated from forage dry matter, animal demand, loss, reserve, and planned grazing length.
| Cattle class | Typical weight | AU factor | Daily dry matter |
|---|---|---|---|
| Stocker calf | 500 to 700 lb | 0.55 to 0.70 AU | 13 to 19 lb DM |
| Yearling heifer or steer | 700 to 950 lb | 0.75 to 0.95 AU | 18 to 25 lb DM |
| Dry mature cow | 1000 to 1250 lb | 1.00 to 1.15 AU | 22 to 30 lb DM |
| Cow calf pair | 1100 to 1400 lb cow | 1.15 to 1.35 AU | 29 to 38 lb DM |
| Heavy finishing steer | 1000 to 1300 lb | 1.00 to 1.30 AU | 26 to 34 lb DM |
| Mature bull | 1600 to 2200 lb | 1.50 to 2.00 AU | 38 to 55 lb DM |
| Lactating dairy cow | 1300 to 1600 lb | 1.40 to 1.80 AU | 42 to 58 lb DM |
| Forage basis | Usable DM at 40% | 120-day cow pair rate | Acres per pair |
|---|---|---|---|
| 1200 lb DM/ac drought range | 480 lb/ac | 0.11 head/ac | 9.0 acres |
| 2200 lb DM/ac native range | 880 lb/ac | 0.20 head/ac | 4.9 acres |
| 3500 lb DM/ac mixed pasture | 1400 lb/ac | 0.33 head/ac | 3.0 acres |
| 5000 lb DM/ac improved grass | 2000 lb/ac | 0.48 head/ac | 2.1 acres |
| 7500 lb DM/ac irrigated forage | 3000 lb/ac | 0.72 head/ac | 1.4 acres |
| Grazing period | AUM per 1 AU | Best use | Stocking effect |
|---|---|---|---|
| 14 days | 0.47 AUM | Rotation paddock check | Higher head/ac possible for short stays |
| 30 days | 1.00 AUM | Monthly feed planning | Easy comparison to AUM per acre |
| 90 days | 3.00 AUM | Spring or summer block | Needs matching to seasonal growth curve |
| 120 days | 4.00 AUM | Main grazing season | Requires reserve for dry spells |
| 180 days | 6.00 AUM | Long season stocking | Lower head/ac unless regrowth is strong |
| Scenario | Forage basis | 90-day head/ac | 120-day head/ac |
|---|---|---|---|
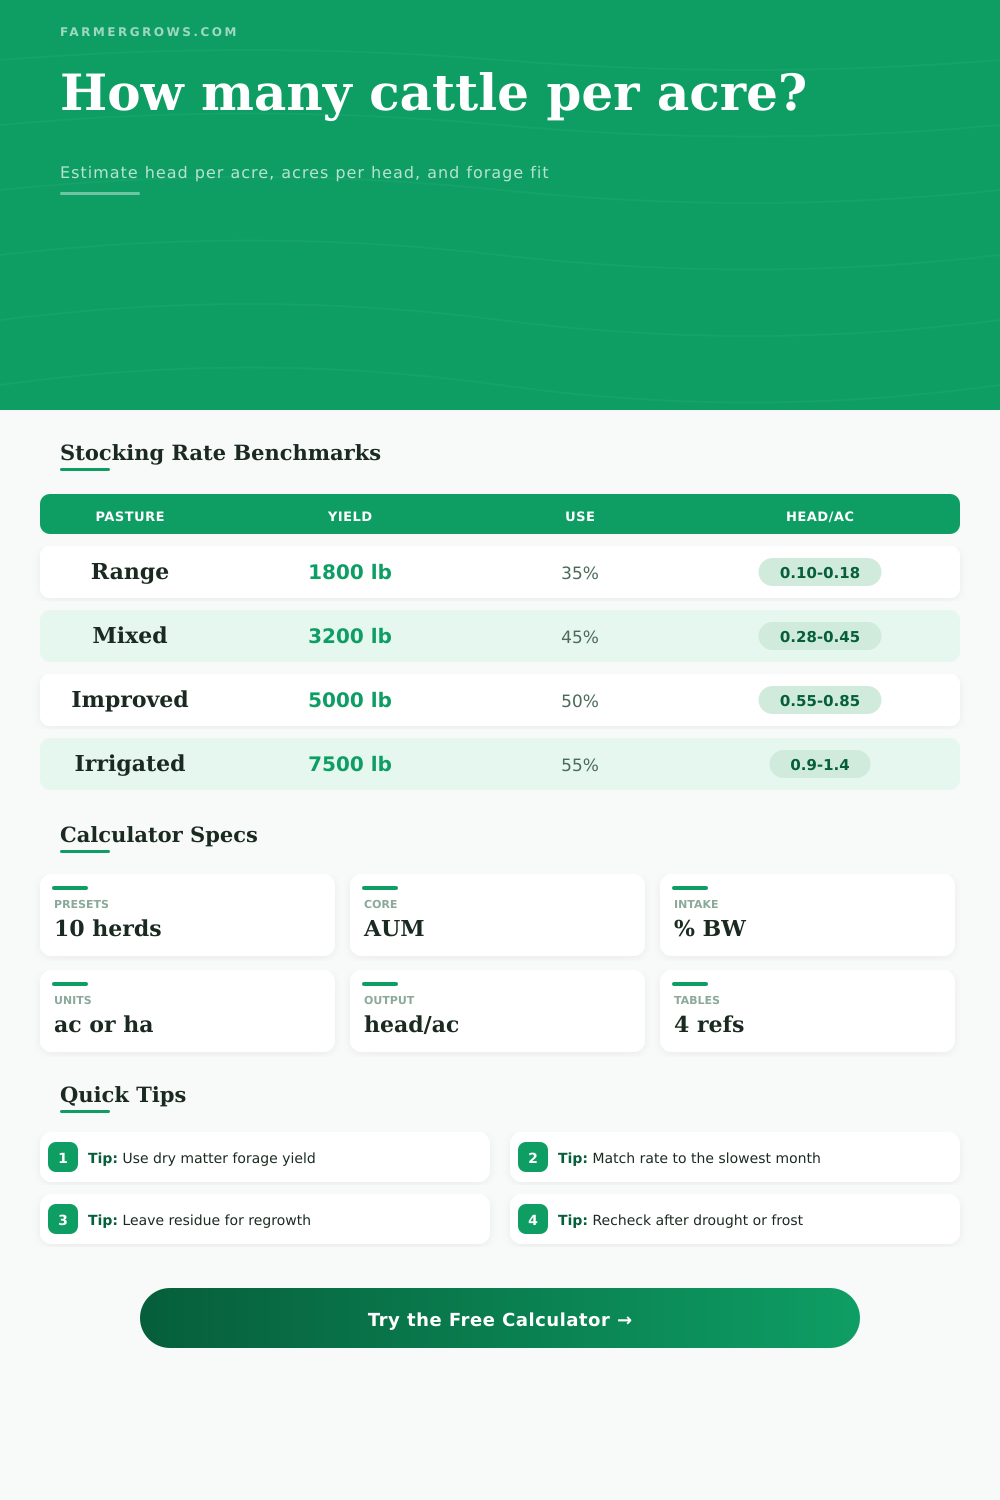
| Native range cow pairs | 1800 lb/ac at 35% | 0.19 to 0.23 | 0.14 to 0.18 |
| Mixed stocker pasture | 3200 lb/ac at 45% | 0.75 to 0.95 | 0.55 to 0.70 |
| Bermuda cow pairs | 4800 lb/ac at 50% | 0.65 to 0.82 | 0.48 to 0.62 |
| Irrigated dairy pasture | 7500 lb/ac at 55% | 0.95 to 1.25 | 0.70 to 0.95 |
Stock for forage, not fence size. A small green field can still be short if dry matter yield, regrowth, water access, or residue reserve is limited.
Recalculate when conditions shift. Cow weight, calf size, rainfall, frost, forage maturity, and rotation length can change head per acre quickly.
To understand what’s happening on the ground, stop looking at fences. Most first-time graziers start here: they look at the land. They figure out how many acres there is; they picture in their heads how big a herd would be; then they buy livestock they imagined having. And soon it becomes clear why so much beginning grazing are done backwards, because they end up overgrazing their pasture; stressing their soils; and going broke come August.
First, focus on the forage. Think about your pasture as a bank account. Each time grass grows, it deposits value into the bank. When a cow consume the grass, she takes value from the bank. With the calculator above, you can reconcile this ledger: turn unclear terms such as animal units and dry matter yield into an actual number of head per acre. And in doing so, it will force you to acknowledge: Not all cows are created equal; nor are all acres.
How to Calculate Stocking Rate
Dry matter is starting point for all stocking rate calculations. Dry matter is weight of the plant without the water. Why does it matter? Cows don’t consume moisture; they consume energy. Even though a springtime pasture may feel lush and heavy with wetness, a lot of that weight is actualy water contained within leaf structure. As you guess your forage yield, you’re anticipating the number of pounds of edible tissue that will be produced throughout the season. Next, you’ll use a utilization factor, essentially, your permission to safely harvest how much of that tissue. Too high of a utilization factor, and you kill root system. Too low of a utilization factor, and you leave grass to lignify, rendering it indigestible. Striking this balance isn’t a precise science, rather more of a respect-for-the-limits-of-your-land science.
Second, on the demand side, understand that one head doesn’t necessarily equal one head. For example, a 600-pound stocker calf doesn’t eat nearly as much than a two-thousand pound bull. That’s why the tool balance these differences through what’s called an animal unit factor. Normally, an animal unit is defined as either a thousand-pound cow with a calf attached, or something that requires same amount of energy per month. Why does this matter? Because if you have a mixture of different classes of cattle, for instance a herd containing both bulls, cows and heifers, it means you can mix them together and not break the math. They’re still counted as equivalent consumers. And folks frequently make this mistake by counting noses when they should of be counting stomachs.
Then there’s issue of season length. If you’re grazing for only thirty days, it’s not the same as if you’re grazing for one hundred and eighty days. In that case, you can have a greater stocking density because you move your animals off a piece of ground before they overgraze, giving plants time to recover. That means more infrastructure and some sort of active management. On the other hand, long-season grazing is easier, but you need a large land base so that entire forage supply doesn’t run out before end of the season. To account for this, the calculator lets you specify number of grazing days, which directly scales total forage demand.
And finally: Build yourself some wiggle room. Nature does not act predictably. Frosts occur early and droughts arrives. Cattle gain weight beyond expectations. Establishing a ten-to-twenty-percent buffer zone between your forage supply and your actual needs protects against these variables. Otherwise, you’re taking a gamble with your pastures’ health.
As a sanity check, refer back to the reference tables found on the page, which compare forage yields for everything from high-yield irrigated forages to fragile shortgrass range. You might find that you’ve under-estimated your yield, or over-estimated the appetites of your cattle, if your calculated rate is well-outside this range.
The bottom line: Stocking rate isn’t a static figure. It’s a dynamic relationship between animal consumption and what land can produce. As seasons change, rainfall patterns change and how mature plants are affects their nutrient density. Adjust accordingly. Use the tool as a logical baseline and starting point from which to work. But ultimately, it requires that you walk in the field, see the grass height, listen for the pulse of your operation and make final call yourself. Do the math first; use your eyes second.