
The next time you’re standing at the supermarket with a bag of strawberries and a banana, one that you think is healthier than the other, or a sugar bomb, you might be right. Or not. Because the headlines makes every type of carbohydrate seem like the same thing. And it’s not. Whole fruit isn’t the same as a sugar cube. When it’s paired with nutrients, water, and fiber, it’s different than pure sugar.
Learning which fruits contains the most concentrated amounts of sugar helps change how we snack and shop. But it also changes how we see what we eat on a day-to-day basis. If you know where to look, the worry goes away. It is true for the most part.
Why Whole Fruit Is Better Than Just Sugar
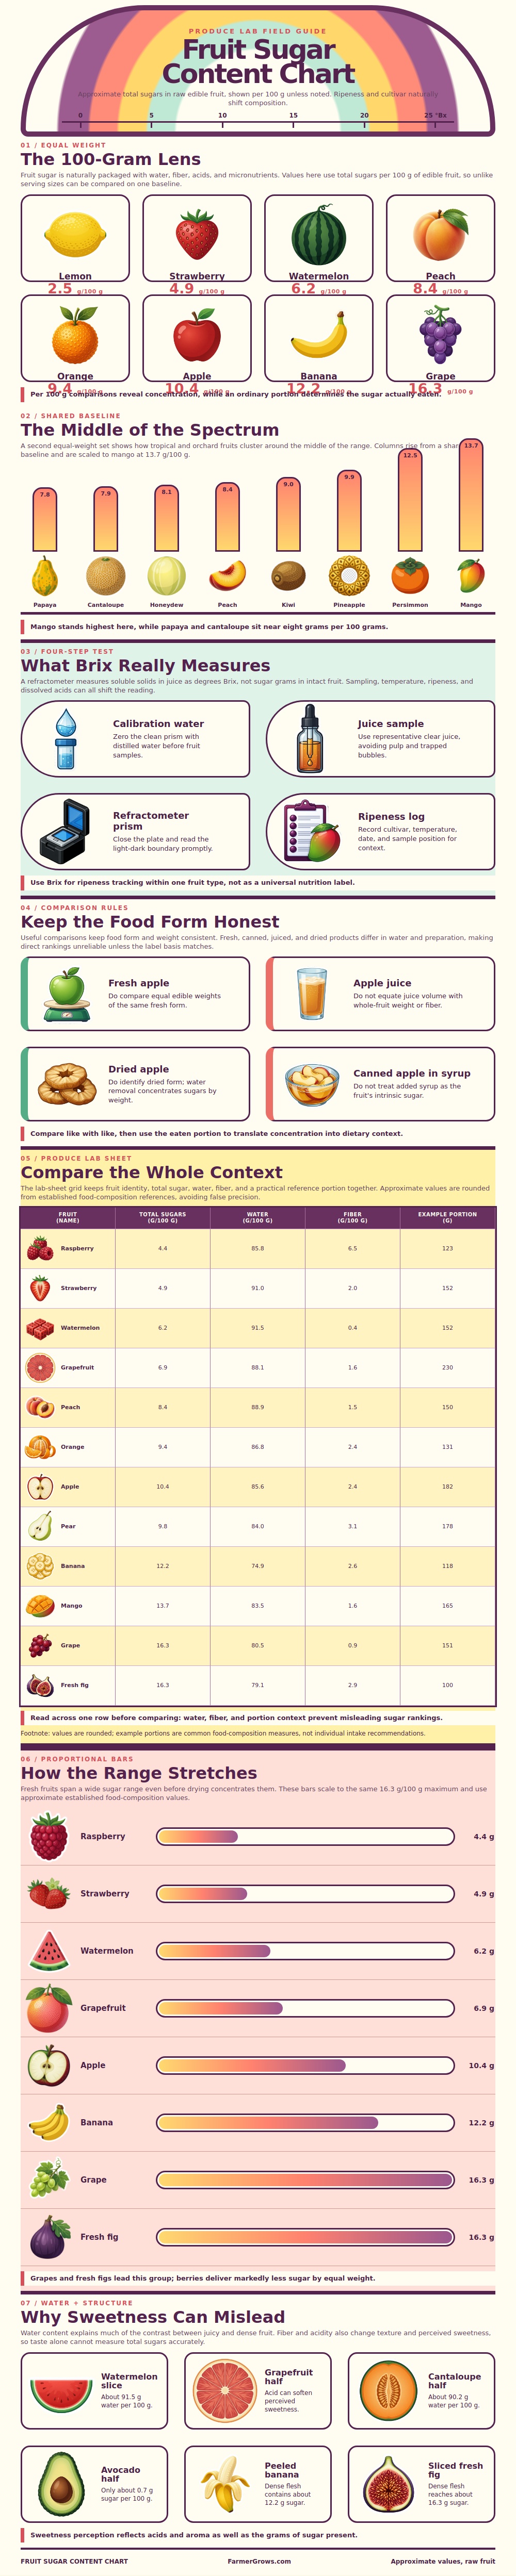
In the chart above, I’ve removed the confusing differences in serving size and set everything to a fair comparison of one hundred grams. When you do this (the same as looking at food labels), you see that a banana contains more than a dozen grams of sugar, where a lemon contain about two and a half grams, a big difference, but put into context.
These aren’t isolated piles of pure starch vs. Pure glucose. These are foods that is mostly water and structural fiber. Berries and melons contains a lot of water which greatly dilutes the sugars they contain. Because most of weight of fruits like these is flavorless water, it’s possible to consume an enormous amount of watermelon without ingesting much sugar at all. It’s the volume that saves you.
The most important part is the matrix. Digestion of a food occurs slowly when it’s in its original form. Such as a piece of fruit with the water and other cellular structure that binds it to the sugar. Juice bypasses the digestive system because fiber has been extracted, which slows the absorption of glucose. This chart shows that point, and you should look at the comparisons within the chart itself.
One apple is not like another. An actual apple differs from apple juice, which differ from dried apple chips. Removing the water increases the concentration of sugars in the food. That’s why one small serving of dried fruit may affect your body more than an entire fruit picked from the same tree. Form = function.
Those numbers are affected by ripeness as well: Brown-spotted bananas is softer and sweeter then green ones, which are firm and starchy. Ripening converts the starch into sugar. Not bad: that’s just nature.
Those figures are averages, not hard-and-fast rules of thumb. To get a Brix reading, or a measure of the sweetness potential of your fruit, use a refractometer (a tool used by cooks and farmers). But unlike a nutrition label, it doesn’t show how healthy the fruit is; instead, it shows how ripe it is. The visual’s test has four steps, all meant to stress accuracy, since both pulp and temperature can throw off the number. We trust our tools too easy, never mind their limitations.
And this is the whole picture: The produce lab sheet includes sugar, but also water and fiber content. That’s the important gap in most dietary advice. Look at raspberries, for example; they have low sugar compared to grapes but high fiber, making them a low-glycemic fruit. Grapes, with more sugar and lower fiber, affects your metabolism differently. So scan across the entire row, not just at the sugar column. Water and fiber are factors that change metabolic impact. The sugar grams, alone, will hide water-hydration factor and the fiber-protective factor.
Forget the grams. Think about structure. Nature has struck a balance between the sweet and sour, and the bulk of a fruit, so eat your fruits as nature intended; in their entirety. Next time you grab a banana off the bunch, think: it’s not a candy bar. It is a complex package. And the strawberry isn’t simply a treat; it’s hydration with fiber. Yes, there’s sugar. But that’s not the difference. What else comes along? Let the body take care of the rest. Eat the whole thing.