Feed Conversion Ratio Calculator
Measure feed intake against live weight gain, compare the result to real livestock benchmarks, and size your ration on the same basis.
Choose a real class setup to seed the calculator. Each preset sets unit system, animal class, scope, head count, days, feed, gain, target gain, waste, and feed dry matter.
Feed Conversion Output
Calculated from the selected animal class, scope, waste, and feed basis.
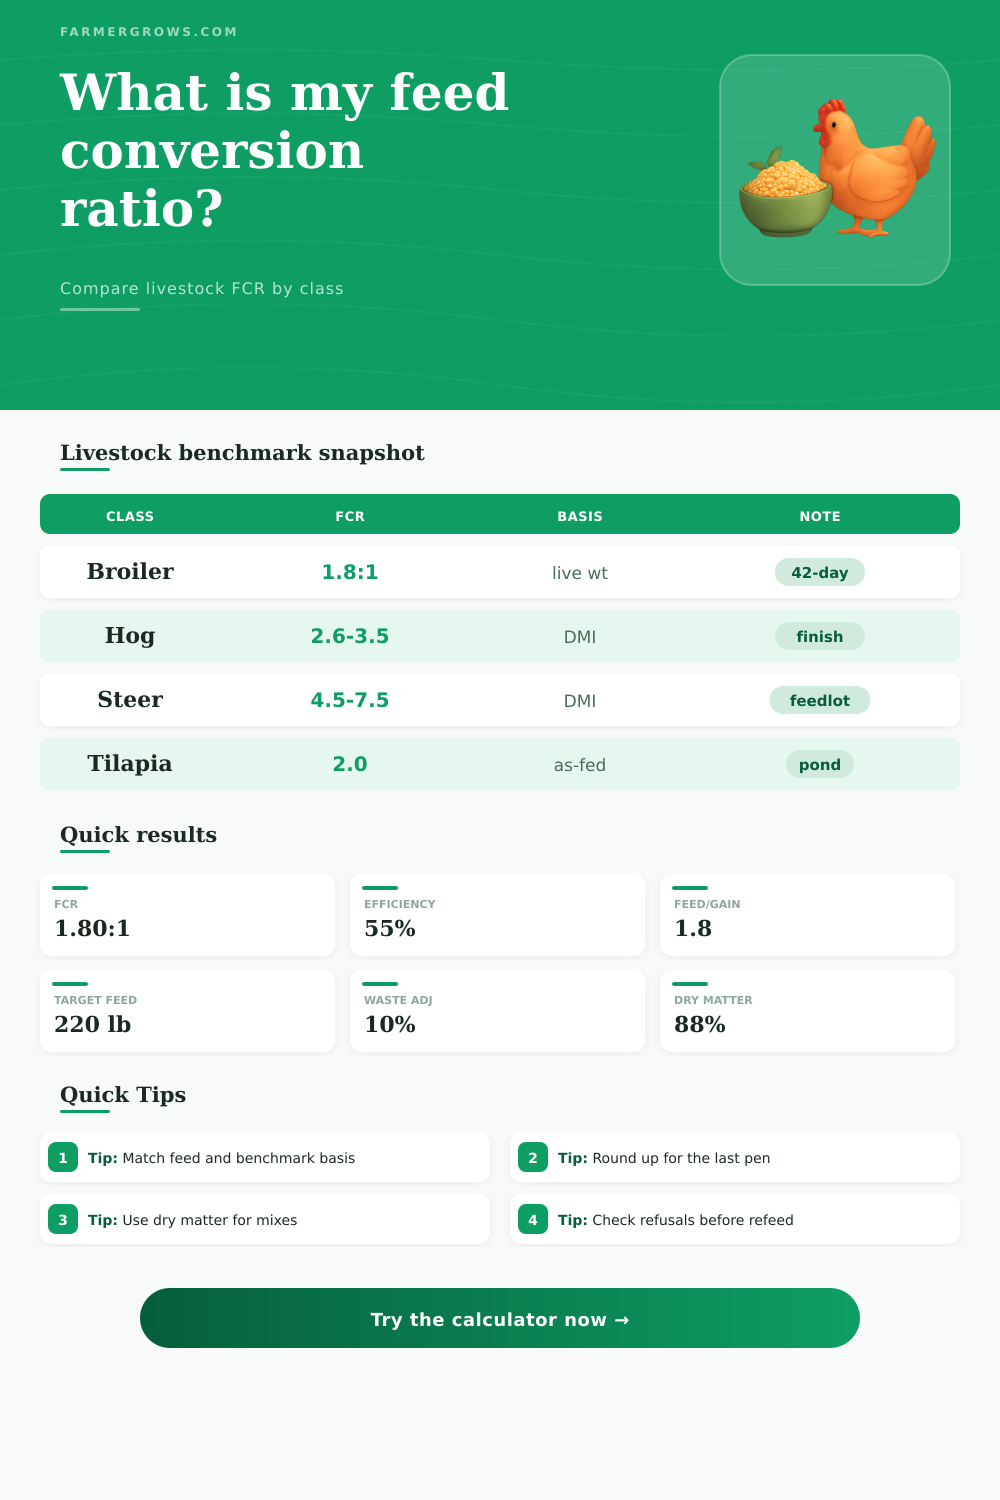
| Class | Typical FCR | Basis | Notes |
|---|---|---|---|
| Broiler chicken | About 1.8 | Feed / live wt | North America typical for a 42-day bird |
| Market hog | 2.6 to 3.5 | DMI / gain | Contemporary hogs finished near market weight |
| Feedlot steer | 4.5 to 7.5 | DMI / gain | Typical feedlot range from good to poor efficiency |
| Sheep | 4.1 to 11.7 | DMI / gain | Ration quality and stage change the result quickly |
| Goat | 3.9 to 10.5 | DMI / gain | High-concentrate diets improve the ratio |
| Aquaculture | 1.3 to 2.5 | Feed / gain | Species, water quality, and feed form matter a lot |
| Start lb | 200 | 220 | 240 | 260 |
|---|---|---|---|---|
| 40 | 3.3 | 3.4 | 3.5 | 3.6 |
| 60 | 3.4 | 3.5 | 3.6 | 3.7 |
| 80 | 3.5 | 3.6 | 3.7 | 3.8 |
| 100 | 3.6 | 3.7 | 3.8 | 3.9 |
| Animal | Feed / live wt | Feed / edible wt | Protein conv |
|---|---|---|---|
| Chicken | 2.5 | 4.5 | 20% |
| Pork | 5.0 | 9.4 | 10% |
| Beef | 10.0 | 25.0 | 4% |
| Carp | 1.5 | 2.3 | 30% |
| System | Typical FCR | Setting | Note |
|---|---|---|---|
| Running water carp | 2.5 | Pond | FAO example with supplemented feed |
| Floating net tilapia | 2.0 | Cage | FAO example in floating cages |
| Semi-intensive shrimp | 1.3 | Pond | Good water and consistent feeding |
| Intensive shrimp | 1.7 | Pond | Higher biomass, tighter management |
The feed conversion ratio are used to determine the efficiency in which livestock producer can convert feed into weight for the animals. To calculate the feed conversion ratio, livestock producers divide the total amount of feed consume by the total weight of the animals gained by those livestock. If the result of the feed conversion ratio calculation is 1.8:1, it means that 1.8 pounds of feed were required to produce 1 pound of live weight from those animals.
The feed conversion ratio is a helpful metric for determining whether or not a ration is effective providing weight to the animals, or if the ration is being wasted. The feed conversion ratio uses the weight of the animal when it is sold (live weight) as the measurement of the total weight of the animal. Many animal type have different feed conversion ratios.
Simple Guide to Feed Conversion Ratio
For instance, poultry animals has low feed conversion ratios due to their fast metabolisms and diets of precise pellets. Ruminant animals have more higher feed conversion ratios then poultry animals due to the slow fermentation of roughage in their digestive system. Because moisture content play a role in both feed weight and animal live weight, it is important to account for this moisture in the calculation of the feed conversion ratio.
Most feeds are sold in weights as “as-fed” feeds, which means they are weighed with the water that is contained within the feed. Therefore, if the percentage of dry matter in the feed are not accounted for, the calculations will provide an inaccurate measurement of the feed conversion ratio for the animals. The dry matter in feed is the portion of the feed that is not water.
Quality feed mixes typically contains 88% dry matter. Therefore, if dry matter is not accounted for in the calculation, the feed conversion ratio will appear to be better than it is. Another factor that must be accounted for in the calculation of the feed conversion ratio is feed waste.
If animals does not eat all of the feed that is provided to them, if that feed is wasted, the feed conversion ratio will be inaccurate if that figure is not accounted for in the calculations. Additionally, the feed conversion ratio can be calculated in relation to each individual animal (per head) or in relation to the group of animals (per pen). Calculating the feed conversion ratio per pen can help farmer to determine if certain animals are hogging the feed space provided to all of the animals in that pen.
If certain animals are hogging the space provided to the group of animals, that can lead to inefficiencies in the feeding of those animals in the barn. Animals have different feed conversion ratios. For instance, broilers has feed conversion ratios of around 1.8 at 42 days of age.
Hogs that are being slaughtered for consumption aim for feed conversion ratios of between 2.6 and 3.5 when using dry matter intake calculation. Feedlot cattle have feed conversion ratios of between 4.5 and 7.5. Sheep and goat have feed conversion ratios of between 4 and 11 due to changes in the quality of the forage that they eat.
Additionally, fish and shrimp has low feed conversion ratios; for instance, tilapia fish in ponds have feed conversion ratios of under 2 because the water in the pond provides them with adequate oxygen for their bodies to absorb nutrients from the feed provided to them. However, there are potential mistake in calculating the feed conversion ratio. For instance, if farmers do not account for the feed that animals refused to eat, the calculation will appear to be better than it is.
Additionally, if farmers calculate the feed conversion ratio for different feeding phase of the animals together, inaccuracies will result from such calculations. For instance, if farmers feed different ration to animals during the feeding period, the ratio will no longer be accurate. Additionally, if the animals has subclinical illnesses that require more feed to be provided to them, the calculations will appear to be better than the animal’s true feed conversion ratio.
The feed conversion ratio can be used to make decision regarding the nutrition of the animals. For instance, if the feed conversion ratio for a hog that is being slaughtered for consumption is above 3.5, it may be beneficial to reduce the protein content in the feed that is provided to the animal during its finisher phase. If the lambs that are being slaughtered is finishing on barley, feed management practice can be applied to lower the feed conversion ratio from 6 to 4.5.
Additionally, if the feed conversion ratio for tilapia in a pond is 2.0, aerators can be installed in the pond to maintain that low feed conversion ratio. In addition to feed conversion ratios, it is beneficial to calculate the protein conversion of the animals. Protein conversion is a calculation of how much of the feed that is consumed by the animal is converted to edible meat.
For instance, chickens have a protein conversion of around 20%, but beef have a protein conversion of only around 4%. By calculating these two numbers, farmers can determine if they need to change there veterinarian or feed mill. By monitoring these numbers, farmers can gain a thorough understanding of their management of the livestock and feed costs, factors that is essential in maximizing the profitability of their livestock operation.