🌱 Cover Crop Calculator
Plan field area, PLS-adjusted seeding rate, and biomass nitrogen contribution in one calculator. Compare preset blends, then dial in the seed order and next-crop credit.
Use the shape controls for area, then enter a target seeding rate and biomass plan. The calculator converts everything to common units before it applies PLS and N credit formulas.
Cover crop output
PLS, area, and biomass factors are applied to the field plan.
Rectangle uses length x width. Circle uses pi x r squared. Triangle uses one-half x base x height. Custom area accepts acres or hectares.
PLS percent = purity x germination / 100. Actual bulk rate = target PLS rate x method factor x buffer / PLS fraction.
Biomass N pool = dry biomass x tissue N percent. It is the starting nitrogen pool before release, weather, and residue adjustments.
N contribution = biomass N x release timing x residue handling x temperature x recovery factor for the next crop.
These tables keep the calculator transparent. The presets use the same kinds of ranges and factors so the output stays grounded in field-style planning.
| Cover crop | Rate | Use | Note |
|---|---|---|---|
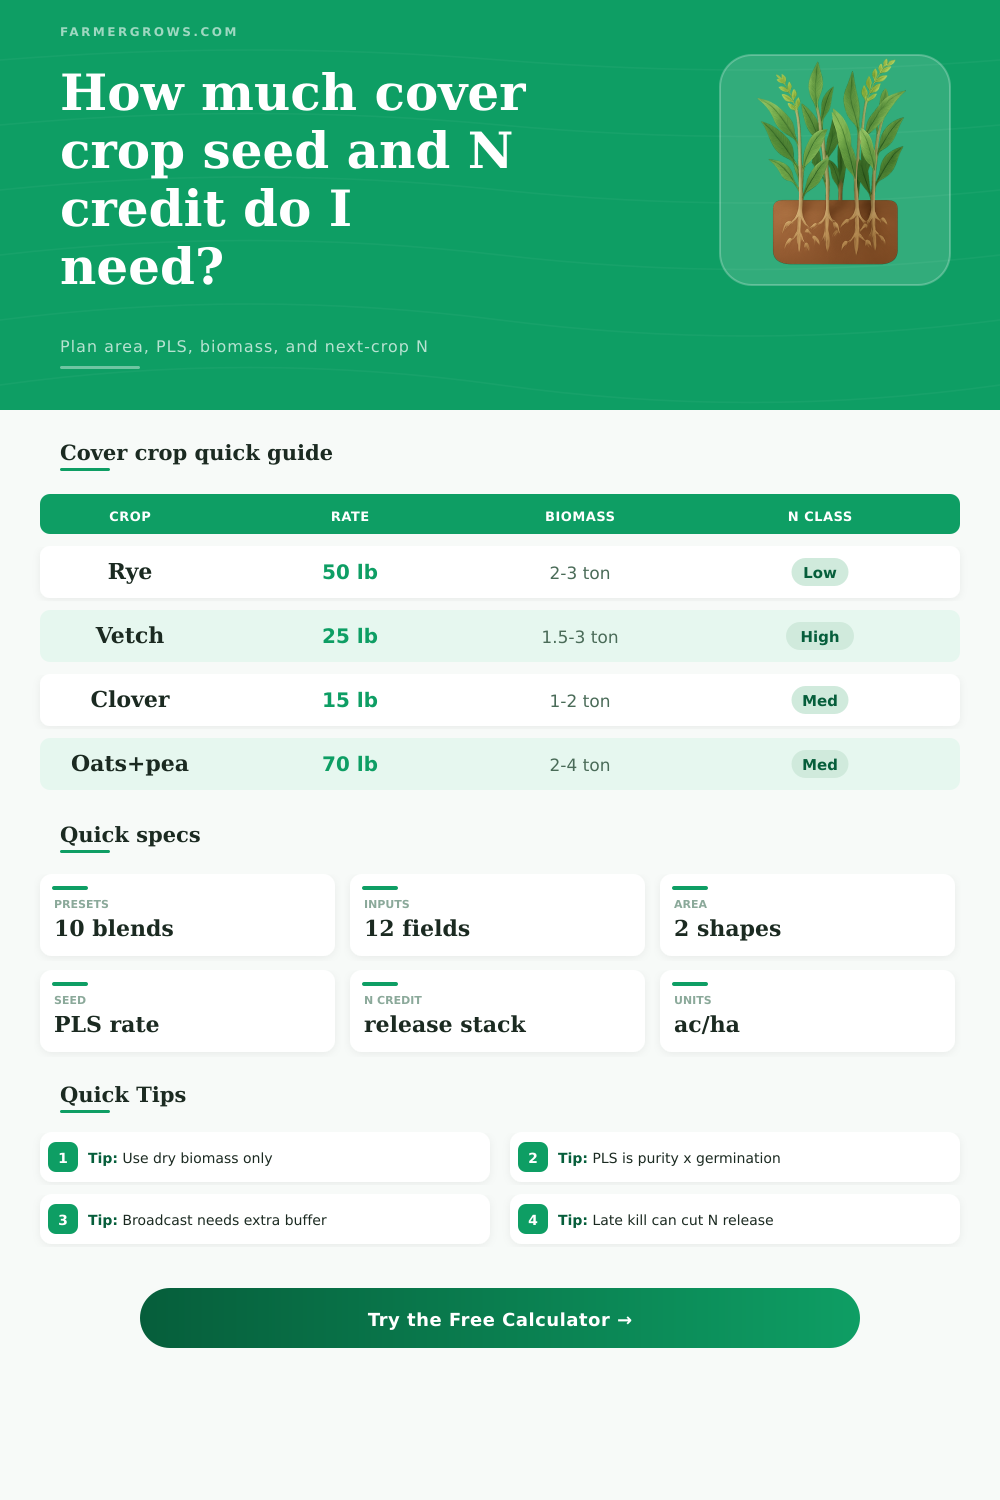
| Cereal rye | 40-60 lb/ac | Fall cover | Cold hardy |
| Hairy vetch | 20-35 lb/ac | N fixer | Needs PLS |
| Crimson clover | 10-20 lb/ac | Quick legume | Fast spring |
| Oats + pea | 50-80 lb/ac | Mix blend | Good bulk |
| Purity | Germination | PLS | Multiplier |
|---|---|---|---|
| 98% | 95% | 93.1% | 1.07x |
| 95% | 90% | 85.5% | 1.17x |
| 90% | 85% | 76.5% | 1.31x |
| 85% | 80% | 68.0% | 1.47x |
| Cover crop | Biomass | N % | Credit class |
|---|---|---|---|
| Cereal rye | 2-3 ton | 0.8-1.2 | Low |
| Hairy vetch | 1.5-3 ton | 3.0-4.5 | High |
| Crimson clover | 1-2 ton | 2.5-3.5 | Med |
| Oats + pea | 2-4 ton | 1.5-3.0 | Med |
| Factor | Value | Effect | Use |
|---|---|---|---|
| Early kill | 1.10x | Faster release | Spring work |
| On time | 1.00x | Baseline | Normal plan |
| Late kill | 0.88x | Slower release | Warm finish |
| Corn crop | 70% | Strong uptake | High demand |
Rye and triticale usually sit in the high-biomass, low-N lane. They anchor the blend and push soil coverage hard.
Vetch, pea, and clover bring tissue N up and can raise the next-crop credit when release timing is favorable.
Radish and turnip add rooting power, scavenge nitrate, and can change the release stack when they break down.
Mixed stands help spread risk. The calculator keeps the seed math and the nitrogen math visible for each scenario.
Always apply PLS before ordering. A seed lot with high germination but low purity can still need a much heavier bulk rate.
Release depends on kill timing, residue handling, and soil temperature. Use the N credit as a planning estimate, not a promise.
Use this cover crop calculator to size field area, adjust seed to PLS, and estimate biomass nitrogen contribution. It keeps the seed order and the next-crop credit in one place.
To determine how many pound of seed are needed for a field for cover crops, people often struggle with the fact that field shapes and seed quality makes it difficult to calculate the amount of seed necessary. However, using the proper steps in the calculation will allow farmers to prepare properly for there fields. The first step in calculating the amount of seed to purchase for cover crops is to determine the area of the field.
The shape of the field are critical in determining how much seed will be required for the process. Fields often contain irregular shapes of land. To find the area of these field, farmers would have to make precise measurements of the fields.
How to Calculate Seed Needed for Cover Crops
Once farmers had determined the area of the field, the next step would be to determine the seeding rate that was targeted for that field. The target seeding rate would determine the amount of pounds of seed that was necessary to establish plants within the soil of that field. Another essential factor in creating the proper amount of seed to sow within the field is the quality of the seed.
To determine the quality of the seed, two separate measurement would have to be calculated. The first would be the purity of the seed and the other would be the germination rate of the seed. The product of these two measurements would result in a value known as the Pure Live Seed, or PLS.
This number would determine the true amount of seed that would grow within the fields. If the farmer do not calculate this number, he or she may order too little seed to cover that field. Additionally, the other factor that would influence the amount of seed necessary is the method in which that field was to be planted.
If the farmer chose to broadcast the seed, as opposed to drilling the seeds into the soil, the farmer would have to order more seed. Broadcasting involve scattering the seed on the land’s surface. When doing this, there would be issues with the seeds finding the soil to germinate.
Thus, there would need to be a buffer of extra seed for this process. There are a variety of benefit to cover crops for the soil. The type of seed that could be planted in these fields include species like rye, vetch, oats, and peas.
Rye produces a significant amount of dry biomass and helps hold the soil in place. Another benefit of rye is that it contain low amounts of nitrogen in its plant tissue. Vetch contains high amounts of nitrogen at a rate of 3 to 4 percent in its green plant matter.
For farmers looking to add nitrogen to their soil for the future crop, vetch is a beneficial crop to include in cover crop rotations. For farmers looking to build dry biomass, however, rye is the better of the two options. Oats and peas offer benefits to cover crops that is in between the two options.
For cover crops to have benefits for the soil, the biomass and nitrogen concentration that the crop produces are essential. Biomass is the dry weight of the plant matter per acre. The amount of nitrogen in that biomass is also critical for understanding the benefit of the plant to the soil.
The nitrogen in the soil will not be instantly released from the cover crop when it is planted in the soil. If the cover crop is terminated early, the soil will mineralize the biomass more faster. Early termination results in up to 10 percent more nitrogen available for the next crop.
If the cover crop is terminated later in the growing season, the cover crop will release less nitrogen. The rate at which the soil heats will determine the rate at which the nitrogen is released from the biomass of the cover crop. If the soil is warm, the nitrogen will release at a faster rate than if the soil were cool.
When the soil is no longer covered by the cover crop, the next crop that is planted into that field will utilize the nitrogen from the cover crop. Corn will use approximately 70 percent of the nitrogen in the soil. Soybean plants will require less nitrogen since they contain the ability to fix their own nitrogen in the soil; soybeans will use approximately 55 percent of the amount of nitrogen that the cover crop provided.
The soybean will not use up all of the nitrogen that was added to the field with the cover crop; however, the soybean will save the farmer money on the amount of commercial fertilizer that he or she must purchase to grow that crop. A common mistake that farmers may make when planning for cover crops is to fail to include a buffer of seed for the cover crop. A buffer of seed is one that is ordered in excess of the amount that would typically be needed.
This is used to account for potential error in the process. A buffer can be used for 10 percent of the seed if planting the seeds in rows, but if broadcasting the seeds, a buffer of 15 or 20 percent of the total amount of seed may be needed. Another mistake is to ignore the amount of biomass that the cover crop will contain.
Many cover crops will contain a large amount of biomass but a significantly low percentage of nitrogen. These two factor are essential to calculating the benefit that the cover crop will provide to the soil. The biomass should be calculated as dry weight, not wet weight, of the plant matter to ensure that the calculation is accurate.
Various environmental factors will affect cover crops and the benefit that they provide to soil. Clay soils will hold the organic matter produced by the cover crops longer than sandy soil. Should animals graze upon these cover crops, they will remove some of the nitrogen from the field.
This can remove 70 percent of the nitrogen that was in the field. One of the most significant factors that will impact the rate of release of nitrogen is the weather. If the field contains hot springs, the effect of the hot spring can cause the nitrogen to break down at a faster rate.
Cool springs can significantly reduce the rate at which the nitrogen is released from the biomass in the soil. Following the information presented above, if farmers use the proper math to calculate the area of the field based on the shape of the field, calculate the pure live seed of the cover crop, and calculate the timing of the termination of the cover crop, farmers will be able to effectively manage their soil and plan for their future crops.