Cattle Per Acre Of Pasture Calculator
Estimate safe stocking rate from pasture acres, dry matter yield, grazing utilization, cattle size, intake, season length, drought adjustment, and forage reserve.
Pick a common pasture and herd pattern, then adjust the yield, utilization, cattle class, grazing days, and reserve settings to match the pasture you are checking.
Pasture Stocking Results
Cattle on pasture stocking summary.
More dry matter per acre increases carrying capacity only when cattle can actually graze it.
Short rotations usually allow more use than continuous grazing without shaving pasture too tight.
Large pairs, bulls, and dairy cows use more dry matter and reduce head capacity per acre.
Drought, mud, summer slump, and slow recovery should lower the final stocking target.
| Cattle class | Typical weight | AU factor | Daily dry matter |
|---|---|---|---|
| Stocker calf | 500 to 700 lb | 0.55 to 0.70 AU | 13 to 20 lb DM |
| Yearling heifer | 700 to 950 lb | 0.75 to 0.95 AU | 18 to 25 lb DM |
| Dry mature cow | 1000 to 1250 lb | 1.00 to 1.15 AU | 22 to 31 lb DM |
| Cow calf pair | 1150 to 1400 lb cow | 1.20 to 1.35 AU | 30 to 39 lb DM |
| Mature bull | 1600 to 2200 lb | 1.50 to 2.00 AU | 38 to 57 lb DM |
| Lactating dairy cow | 1300 to 1550 lb | 1.40 to 1.75 AU | 42 to 58 lb DM |
| Pasture condition | Season dry matter yield | Typical utilization | Planning note |
|---|---|---|---|
| Drought-stressed pasture | 800 to 1400 lb DM/ac | 25% to 35% | Keep more residue and shorten the season |
| Native range | 1400 to 2400 lb DM/ac | 30% to 40% | Use conservative rates and watch ground cover |
| Mixed cool-season grass | 2600 to 3800 lb DM/ac | 40% to 50% | Adjust for summer slump and rest period |
| Improved warm-season grass | 4000 to 6000 lb DM/ac | 45% to 55% | Works best with fertility and active rotations |
| Irrigated or high-input pasture | 6500 to 9000 lb DM/ac | 50% to 60% | Capacity depends on regrowth speed and allocation |
| Scenario | Forage basis | 90-day cow pair capacity | Acres per pair |
|---|---|---|---|
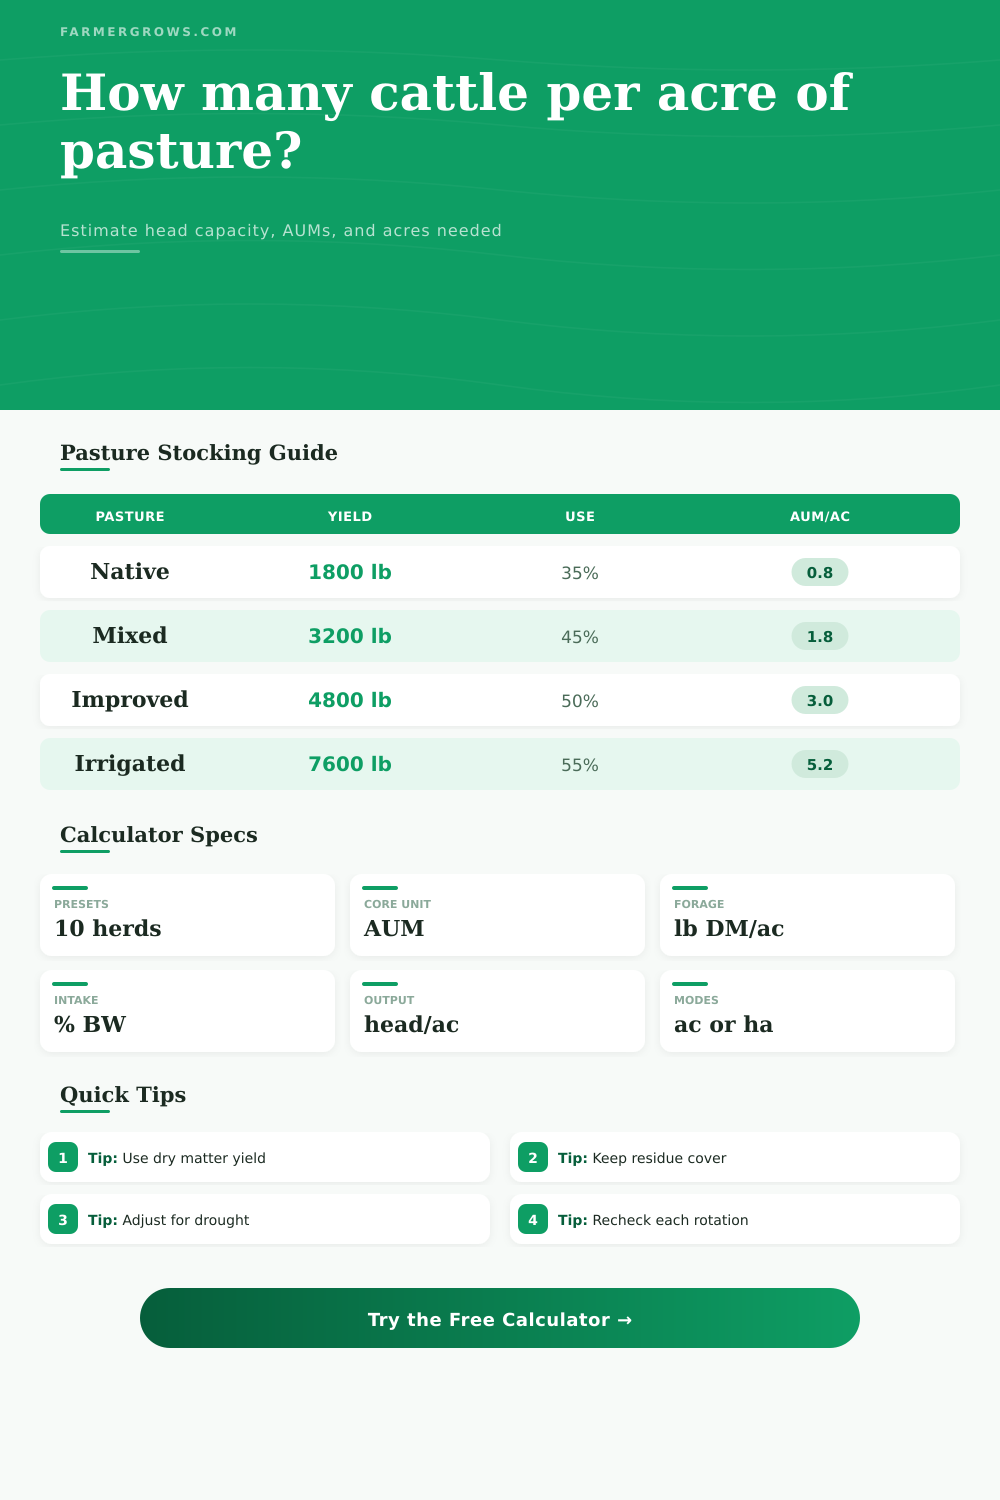
| 20 acre native range | 1800 lb/ac at 35% | 4 to 6 pairs | 3.5 to 5.0 acres |
| 40 acre mixed pasture | 3200 lb/ac at 45% | 18 to 22 pairs | 1.8 to 2.2 acres |
| 25 acre bermudagrass | 4800 lb/ac at 50% | 19 to 24 pairs | 1.0 to 1.3 acres |
| 12 acre irrigated pasture | 7600 lb/ac at 55% | 15 to 19 pairs | 0.6 to 0.8 acres |
Use dry matter, not green weight. Fresh pasture is mostly water, so cattle per acre estimates should start with dry matter yield or a local grazing-stick conversion.
Plan from the limiting month. A pasture may look strong in spring and still run short during heat, drought, frost, or slow regrowth periods.
This all starts with figuring out available acres. Measure perimeter (fence lines) and remove any non-pasture sections such as drainage ditches or woodlots.
Next, check if that leftover forage will carry your herd through to harvest. Because forage isn’t a fixed thing, it’s easy to get lost in this idea. Forage is living: it develops, perishes and rots away. It doesn’t act like an inanimate spreadsheet figure. After inputting herd size and yield estimates, the calculator take care of all that. It translates vague hunches into hard data… Pounds of dry matter and animal unit months.
How to Count Your Grass and Cows
The real work are figuring out what those inputs actualy mean in practice. Most managers think their pastures has more capacity than they actually do. Green means full, right? It is not quite that simple, as green fresh forage are eighty percent water. So as soon as you’re entering yield data, you’re working with dry matter, which is the true energy left behind once the water has evaporated. Let’s say you produce two thousand pounds of dry matter per acre on your range. That’s your budget. Enter that number into the tool to understand what happens to that budget as cattle eat it up and time pass.
A low use rate will help avoid damaging the soil, but even if you think you’re only grazing lightly, you could still be using too much of resource. Leave some of leaf (residue) to allow for recovery and photosynthesis. Residue percentage matter.
Demand on the land vary depending on type of cattle you run. A heavy bull consume more than a lactating dairy cow, and a dairy cow consumes more than a stocker calf, which eats only 3% of his own bodyweight. Animal Unit Factors uses the tool to account for this variation. It also standardizes your herd so you can make direct comparisons between different animals. If the AUM balance is positive, you have extra grass. If it’s negative, you’re out of feed and will require hay. Knowing where you stand early help avoid shortages at the end of the season. It also stresses you less financialy.
But drought doesn’t play well with regular plans. Does a dry year resemble a wet year? No, it does not. To account for differences in weather, the calculator include a season condition factor. When moisture is sparse and plants is turning brown, reduce that number to sixty percent. That’ll force you to plan with scarcity rather than expecting plenty. Tough times require tough love, and survival depend on a conservative approach. Tweak your grazing days and buffer settings. Add a margin for error. Leave ten percent of the forage standing. Think of it as an insurance policy against failed storms.
The land to animal relationship is called stocking rate. A dry native range support fewer heads per acre than an irrigated bermudagrass pasture, which has high capacity. But high capacity come with intense management: moving animals fast, watching regrowth closely. Treat a high-yield pasture as though it were a low-yield one and you’ll have nothing left. The tool’s reference table explain all this. It illustrates that there is a tradeoff between yield and use. Graze harder by rotating faster while giving plants longer rest periods.
It’s not about “getting as many cows out of the ground.” It’s about maintaining a healthy piece of ground so it can grow more forage tomorrow. If your stocking rate push past capacity. By definition, you are reducing soil stability and ground cover. Sooner or later, the pasture will decline. The calculator set the upper limit. Your challenge (and decision) is how far below that threshold you want to play it safe.
Savvy cowboys often let a lot of grass lie down. That appears wasteful, but it preserves the root system. A strong root system leads to a large harvest. You begin with acres of ground; you finish with healthy soil. Running the numbers help you reach that outcome while reducing harm to both environment and finances.