PPFD to PAR Calculator
Convert canopy PPFD into total photon flux, estimated PAR radiant watts, DLI, crop target fit, and fixture count for greenhouse, grow tent, and vertical farm planning.
PPFD is light intensity at the crop surface. PAR watts are an energy approximation based on photon wavelength, so broad-spectrum fixtures should be treated as planning estimates rather than laboratory radiometry.
Shorter photons carry more energy, so the same photon flux estimates more PAR watts.
A practical broad-spectrum planning factor for many horticultural LEDs.
Longer average wavelength lowers radiant watts per photon mole.
Efficient for photon delivery, but crop response still depends on spectrum balance.
| Crop stage | Target PPFD | Common DLI range | Planning note |
|---|---|---|---|
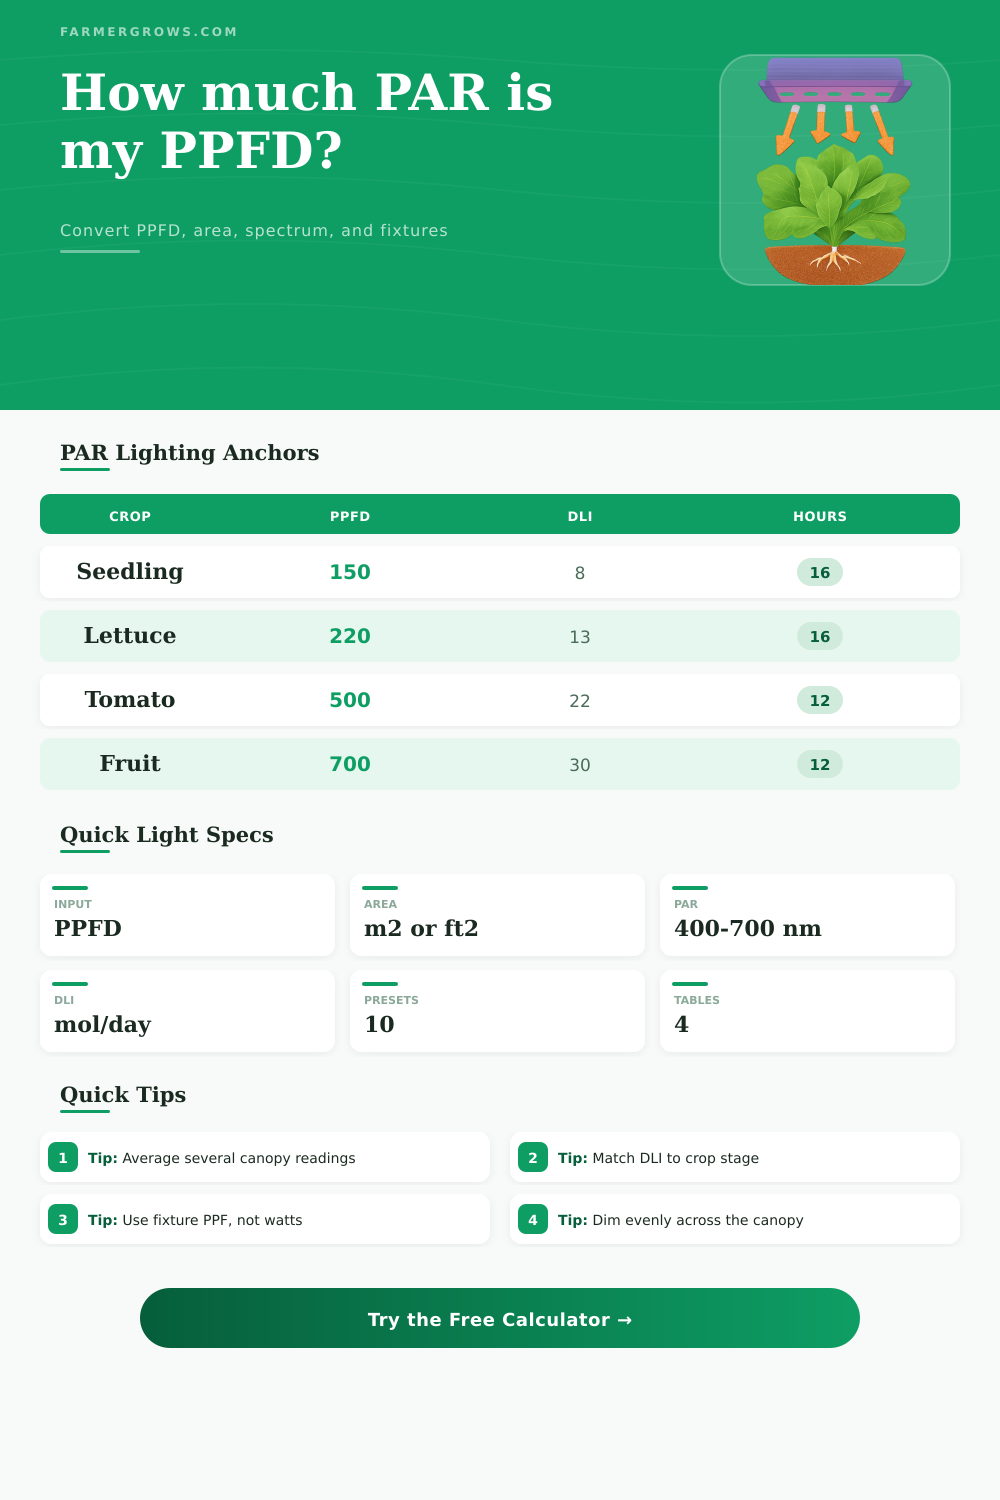
| Seedlings / propagation | 100-200 µmol/m²/s | 6-10 mol/m²/day | Gentle light helps prevent stress and excess stretch. |
| Microgreens | 150-300 µmol/m²/s | 8-14 mol/m²/day | Short crops often run long photoperiods at moderate PPFD. |
| Lettuce / leafy greens | 200-300 µmol/m²/s | 12-17 mol/m²/day | Higher DLI improves growth until heat and tipburn limits appear. |
| Tomato / cucumber | 400-700 µmol/m²/s | 20-30 mol/m²/day | Fruiting crops need more photons and stronger climate control. |
| Spectrum model | Effective nm | PAR W per µmol/s | Use case |
|---|---|---|---|
| Royal blue | 450 nm | 0.266 W | Blue-heavy propagation or spectrum trials. |
| Full-spectrum white | 555 nm | 0.216 W | General LED grow light approximation. |
| HPS / warm spectrum | 589 nm | 0.203 W | Sodium-rich or warm broad-spectrum planning. |
| Deep red | 660 nm | 0.181 W | Red-dominant LED channels and bars. |
| Source type | Typical efficacy | Default fixture PPF | How to use it |
|---|---|---|---|
| High-output LED bar array | 2.7-3.1 µmol/J | 1000 µmol/s | Good for large benches and uniform vertical racks. |
| Full-spectrum LED fixture | 2.3-2.9 µmol/J | 650 µmol/s | Common planning default for tents and small rooms. |
| Double-ended HPS | 1.6-1.9 µmol/J | 1050 µmol/s | Useful legacy comparison where heat load matters. |
| Fluorescent / T5 | 0.7-1.1 µmol/J | 220 µmol/s | Best kept to seedlings, low shelves, and short crops. |
| Canopy footprint | Area | PPF at 300 PPFD | PPF at 600 PPFD |
|---|---|---|---|
| 2 ft x 4 ft shelf | 0.74 m² | 223 µmol/s | 446 µmol/s |
| 4 ft x 4 ft tent | 1.49 m² | 446 µmol/s | 892 µmol/s |
| 4 ft x 8 ft bench | 2.97 m² | 892 µmol/s | 1784 µmol/s |
| 1 m x 2 m rack bay | 2.00 m² | 600 µmol/s | 1200 µmol/s |
Use an average PPFD map. A single center reading usually overstates the useful light reaching edge plants.
Compare DLI, not PPFD alone. A lower PPFD can still meet the crop target when the photoperiod is longer.
PPFD measures photon density at the canopy, PPF scales it across area, and wavelength converts photon flow into an approximate PAR radiant energy value.
When making lighting decisions in controlled environments, it is necessary to understand several different measurement of light. Each of these measurements provide you with information that is necessary to make decisions about the lighting plan for your grow room. For instance, you know how much light the plants need, but you need to determine that light in terms of how many lighting fixture should be used, and for how many hour each of those fixtures should be on.
PPFD (Photosynthetic Photon Flux Density) is a measurement of the amount of photons that land on a square meter each second. PPFD is a sensor that can be positioned at the plant itself. Because of this, PPFD is helpful in determining the amount of light received at different location within the grow room.
How to Measure Light for Your Grow Room
However, PPFD does not provide information regarding the total amount of light that enters the canopy of plants, or the total amount of light that may be distributed throughout that area. PPFD can be measured with a handheld meter, but the reading from the meter alone will not provide the information necessary to develop a lighting plan. To determine the total amount of light that enters the canopy of plant in the grow room, you can multiply the PPFD value by the total area of the crops in the grow room.
This value is referred to as the PPF (Photosynthetic Photon Flux), or the total amount of light that enter the plants in the grow room (in micromoles per second). Thus, PPF is different than PPFD, and provides information regarding the total light output of the grow room. Daily Light Integral (DLI) is a value that calculates the total amount of light that the plants receives each day.
For example, if you apply a PPFD level to the plants for sixteen hours instead of twelve hours, the value of the DLI will be more greater than if the plants were exposed to that PPFD level for only twelve hours. Because plants only respond to the total number of photons that are integrated over the period of each day, the DLI is a more important value than the PPFD. To determine the DLI for the grow room, you can enter the PPFD, the area of the plants, and the length of the photoperiod into a calculator.
The DLI is a value that can be compared to the amounts of light that different plant species requires to grow. Another factor that must be considered in the development of a lighting plan is the spectrum of the lights. For instance, lights that contain a higher concentration of blue light will have more watts per micromole than lights with a deeper red spectrum.
You can calculate these values with a spectrum analysis calculator, and it may be helpful in understanding how much heat the lights will create within the grow room. Furthermore, two different lighting fixture may have the same PPF measurements, but feel different within the grow room due to the difference in the spectrum of the light. Once you know the target PPF that you want to provide to your plants, you can calculate the number of lighting fixtures that is required.
If you know the PPF rating of the fixtures that you plan to purchase, you can divide the target PPF by the output of each individual fixture. This will provide the number of grow room fixtures that are required to provide the PPF that the plants require to grow. However, real grow room are never as even in the distribution of light as calculated fixtures.
The calculator will display the ideal number of fixtures for the grow room. However, if you enter the number of fixtures into the calculator, the light output that will be installed in the grow room can also be displayed. Thus, the grower can determine if any adjustment to the number of fixtures are required.
It is common for grow room manager to make assumptions regarding the total amount of light provided to the crops. For instance, it is common to make the assumption that the PPFD reading that is obtained at one location in the grow room is representative of the entire area. This is inaccurate, however, since the intensity of light diminishes at the edge of the canopy, and within the lower portions of plants.
To account for this, it is necessary to take several measurements of PPFD within the canopy (at different areas), and to use the average of those measurements as the value that is entered into the calculate of the number of lighting fixtures required for the grow room. In addition to the incorrect use of PPFD alone, another common error is to ignore the photoperiod. It is likely that the grower will feel that the plants are exposed to too little light during their photoperiod, but the plants may only require a longer period of exposure to that light.
In these situations, rather than purchasing new lighting fixtures, extending the photoperiod may have solved the issue with less equipment and heat for the grow room. Reference tables exist that provide the DLI values of various plant within different growth stages. These tables are not rules that must be followed, but they are useful in determining if the planned light levels for the grow room are the correct amount for the plants that are to be grown.
For instance, plants in the seedling growth stages requires lower amounts of DLI values than those in the fruiting stages. This is due to the fact that too much light may stress the young seedling. Likewise, fruiting plants require higher DLI values than seedlings, as they must receive the energy to support their growth of both foliage and fruiting plants.
Thus, the leafy greens plants fall somewhere in the middle, but can benefit from increased DLI values to be grown to the limit of other factors (like temperature or tip burn in excessive light exposure). The real grow rooms that is built and used in grow houses are not as simple as the calculations made by the lighting calculator. For instance, the factors of air movement, temperature, humidity and CO2 are other factor in the growth of the plants.
Thus, a grow room may receive an adequate amount of light, but still not experience the growth of the plants that are required. A lower level of light may be beneficial to the plants, provided that the other factor to grow are provided for the plants. These numbers are provided by the lighting calculator, but these are not the complete recipe that must be followed to achieve the best grow room.
Another factor that relates to the lighting fixtures that is installed within the grow room is the efficacy with which the fixtures convert electricity to light. The efficacy of lighting fixtures is measured in micromoles per joule. Thus, efficacy is a measurement that relates to the cost of operation of the lighting fixtures.
Higher efficacy lighting fixtures will cost the grower less money over time, but they may generate less heat than lower efficacy lighting fixtures. However, the higher efficacy lighting fixtures will have a higher initial price for the grower. The electrical watts that the lighting fixtures will use can be estimated by entering the efficacy of the lighting into the lighting calculator.
Thus, the grower can determine the cost of operation of the lighting fixtures before they are purchase. The efficacy of the lighting fixtures can be obtained from the fixture manufacturers, but this estimate will only be as accurate as the efficacy value that the grower enters into the lighting calculator. The process of determining the lighting plan for the grow room is, therefore, a process of scaling.
The first measurement is the intensity of the light at a certain point in the grow room. The second is the total amount of light that is provided to all of the plants (total flux). The third is the total amount of light that is provided each day (daily integral).
These factors are scaled to include the additional variable of spectrum of light and performance of the lighting fixtures. Once these additional factors are understood, the number of lighting fixtures that is required can be calculated. Thus, the lighting calculator allows the grower to focus upon determining if the lighting plan that is developed for the grow room is appropriate and beneficial to the plants and grow room itself.