Phosphorus Per Acre For Corn Calculator
Estimate corn P2O5 fertilizer per acre from acres, yield goal, soil P test, target rate, fertilizer analysis, placement efficiency, starter split, manure credit, soil pH, and erosion or runoff risk.
Pick a common corn P scenario, then tune the soil test, target P2O5 rate, placement method, manure credit, pH, and field acres.
Build rates are usually paired with banding or strip placement so early corn roots reach phosphorus quickly.
Maintenance rates commonly track crop removal, about 0.37 lb P2O5 per bushel of corn grain.
Dry phosphate sources convert directly from P2O5 percent into pounds of product per acre.
10-34-0 and similar liquids are useful for small starter shares, especially in cool or low-testing soils.
Corn Phosphorus Plan
Your field phosphorus result will appear here.
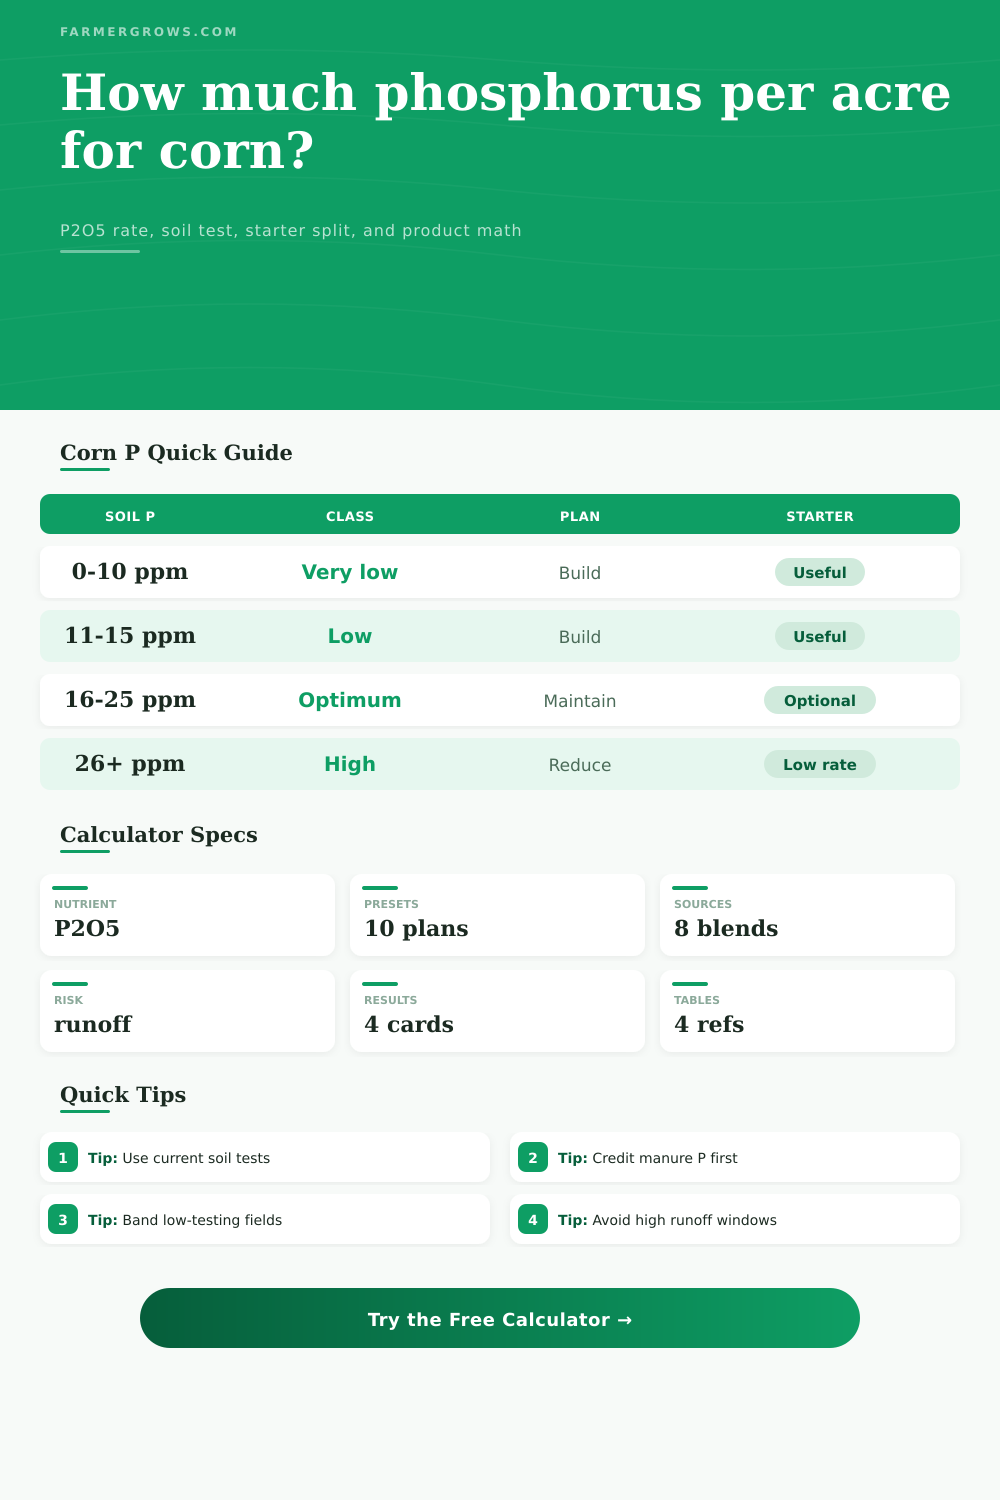
| Soil test class | Approximate ppm range | Calculator adjustment | Common corn response | Planning note |
|---|---|---|---|---|
| Very low | 0 to 10 ppm | Add 40 lb P2O5/ac | High probability of response | Banding can improve early uptake and reduce fixation. |
| Low | 11 to 15 ppm | Add 20 lb P2O5/ac | Likely response | Build toward optimum while meeting crop removal. |
| Optimum | 16 to 25 ppm | No adjustment | Maintenance response | Use yield removal and local critical levels. |
| High | 26 to 40 ppm | Reduce target by 25% | Lower response odds | Small starter may still help cold early growth. |
| Very high | Over 40 ppm | Reduce target by 60% | Low response odds | Avoid extra surface P where runoff risk is elevated. |
| Source | P2O5 analysis | Product for 50 lb P2O5 | Best fit by soil test | Notes |
|---|---|---|---|---|
| MAP 11-52-0 | 52% | 96 lb/ac | Low to optimum | Dry source with ammonium N; common band or broadcast product. |
| DAP 18-46-0 | 46% | 109 lb/ac | Low to optimum | Higher N content; manage seed placement and ammonia risk. |
| Triple superphosphate | 46% | 109 lb/ac | Build or maintenance | Phosphorus without added nitrogen from the source. |
| MESZ 12-40-0 | 40% | 125 lb/ac | Low P plus S or Zn need | Useful where sulfur or zinc is part of the starter plan. |
| 10-34-0 liquid | 34% | 147 lb/ac or 12.6 gal/ac | Low starter rate | Good for banded starter; confirm safe placement rate. |
| Custom blend | User entered | Based on analysis | Any calibrated plan | Use actual tag analysis and density for liquids. |
| Yield goal | P2O5 removal at 0.37 lb/bu | MAP product | DAP product | Maintenance note |
|---|---|---|---|---|
| 150 bu/ac | 56 lb P2O5/ac | 107 lb/ac | 121 lb/ac | Maintenance only if soil P is near optimum. |
| 180 bu/ac | 67 lb P2O5/ac | 128 lb/ac | 145 lb/ac | Check starter need on cool soils. |
| 210 bu/ac | 78 lb P2O5/ac | 149 lb/ac | 169 lb/ac | High-yield removal can draw down soil P quickly. |
| 240 bu/ac | 89 lb P2O5/ac | 171 lb/ac | 193 lb/ac | Use current soil tests before reducing maintenance. |
| Factor | Lower-risk setting | Higher-risk setting | Calculator effect | Field note |
|---|---|---|---|---|
| Band placement | Near-row or strip-till band | Surface broadcast | Efficiency ranges from 82% to 115% | Banding is especially helpful when soil P is low. |
| Soil pH | 6.0 to 7.2 | Below 5.8 or above 7.8 | Availability factor ranges from 82% to 100% | Lime or pH management can improve P availability. |
| Runoff risk | Level, incorporated, buffered | Sloped, frozen, saturated, or near water | Flags caution and estimates surface loss risk | Avoid surface P ahead of runoff events. |
| Starter share | Low to moderate planter-safe rate | High salt near seed | Splits product into starter and base | Follow planter placement and product safety limits. |
Use manure P credits before buying fertilizer. Manure can supply enough available P2O5 to reduce or replace a maintenance broadcast application on some corn fields.
Let placement match the risk. Low-testing fields often benefit from banded P, while high-testing or runoff-sensitive fields need conservative surface applications.
Nitrogen is not like phosphorus. Nitrogen does gets washed out with a big storm, but at least it goes some distance. Phosphorus doesn’t go much further then a couple of inches from where you put it down in the ground. That’s one key part of the riddle facing all growers who are mapping a fertilizer program. Apply enough, but make sure that it gets to the crop when it needs it most (early) and that its roots can reach it.
The calculator above take your soil test and source analysis information as input, and crunches the numbers. No more need for conversions or coefficients, just enter your inputs and let it guide your product rates.
How to Use the Phosphorus Calculator
Soil test results form basis of all your phosphorus plans. If you are below ten parts per million, then things are realy bad and you want a build plan. Once it gets in the sweet spot (the sixteen to twenty-five ppm range) you want to maintain rather than build. Most farmer focus on zero net change. In other words, replace only what is removed by the crop. At this level, the goal is just to replace what the crop use. Again, the system will adjust recommendations accordingly to avoid excess application if the soil is already super-saturated with an available nutrient.
How much you apply is only part of the picture; where you place it make a difference as well. Applying phosphorus closer to the seed row with bands are more efficient, because that’s where the developing root will come into contact with it. If you broadcast it over surface, there’s a good chance it will become fixed (or bound up) in the soil chemistry before the plant can access it. The calculator adjust for these efficiency factors based off the type of placement. For example, a banded application may take a lot less product than an equivalent surface broadcast to get the same farming outcome. This is a small thing, but it has a big impact on your budget and your yield potential.
The availability of phosphorus is also controlled by soil pH. Highly acidic soils will cause phosphorus to combine with aluminum and iron making it insoluble; likewise in an alkaline condition, phosphorus combines with calcium to do the same thing. Soils ranging from about 6.0 to 7.2 are typically the sweet spot for corn. But remember: Outside of that zone, you may have to go up on rate just to overcome any tie-up in the soil matrix caused by chemistry around it. Since the tool factors in pH, it knows that a neutral soil test doesn’t matter much if the surrounding chemistry prevent plants from taking up nutrients.
There’s a final twist: Manure. If you’re spreading it, credit its phosphorus content toward your total need for other fertilzer. Otherwise, it’ll quickly build up and become an environmental concern. The tool lets you reduce your target rate by the amount of available manure phosphorus. This allows you to purchase just the minimum required. You won’t buy too much, which is costly without increasing yield, or too little, which create a deficit.
In today’s world of managing phosphorus, you can’t ignore the risk of runoff. Anywhere phosphorus gets on surface is a big-time water-quality issue, particularly close to waterways or on hilly ground. If your soil test scores are sky-high, maximizing yield take a back seat to minimizing loss. Reducing application rates can help, as can changing to incorporated practices. This tool helps you match your farming goals to environmentally sound practice by flagging those “at-risk” situations. It encourages that dialogue about which nutrients stay in the ground and which ones does not.
The final part of the plan is choosing which fertilizer source to use. Depending on soil conditions and your equipment, there are pros and cons to using MAP, DAP or a liquid starter. For example, if you’re applying across many acres, dry granules is easy to apply. With liquid starters, you can get the right amount at the correct location (in-row) in the planter. The calculator translates your desired nutrients into actual product weights so you can see how much each costs and how it fits in your plans. It connects theory to what works on the ground.
The bottom line: Phosphorus management balance the need for enough nutrients to promote high yields with avoiding an over-abundance in the soil and potential risk of runoff. The correct amount depend on field-specific conditions, there are no one-size-fits-all recommendations. Combining source analysis, placement efficiency, and soil data will allow you to develop a plan tailored to your fields. And that’s what most people miss. Instead of thinking of phosphorus as a variable resource, they consider it to be a single input. It is not just that; getting it right should of started with the soil test and continues through the seed row when you look at the entire system.