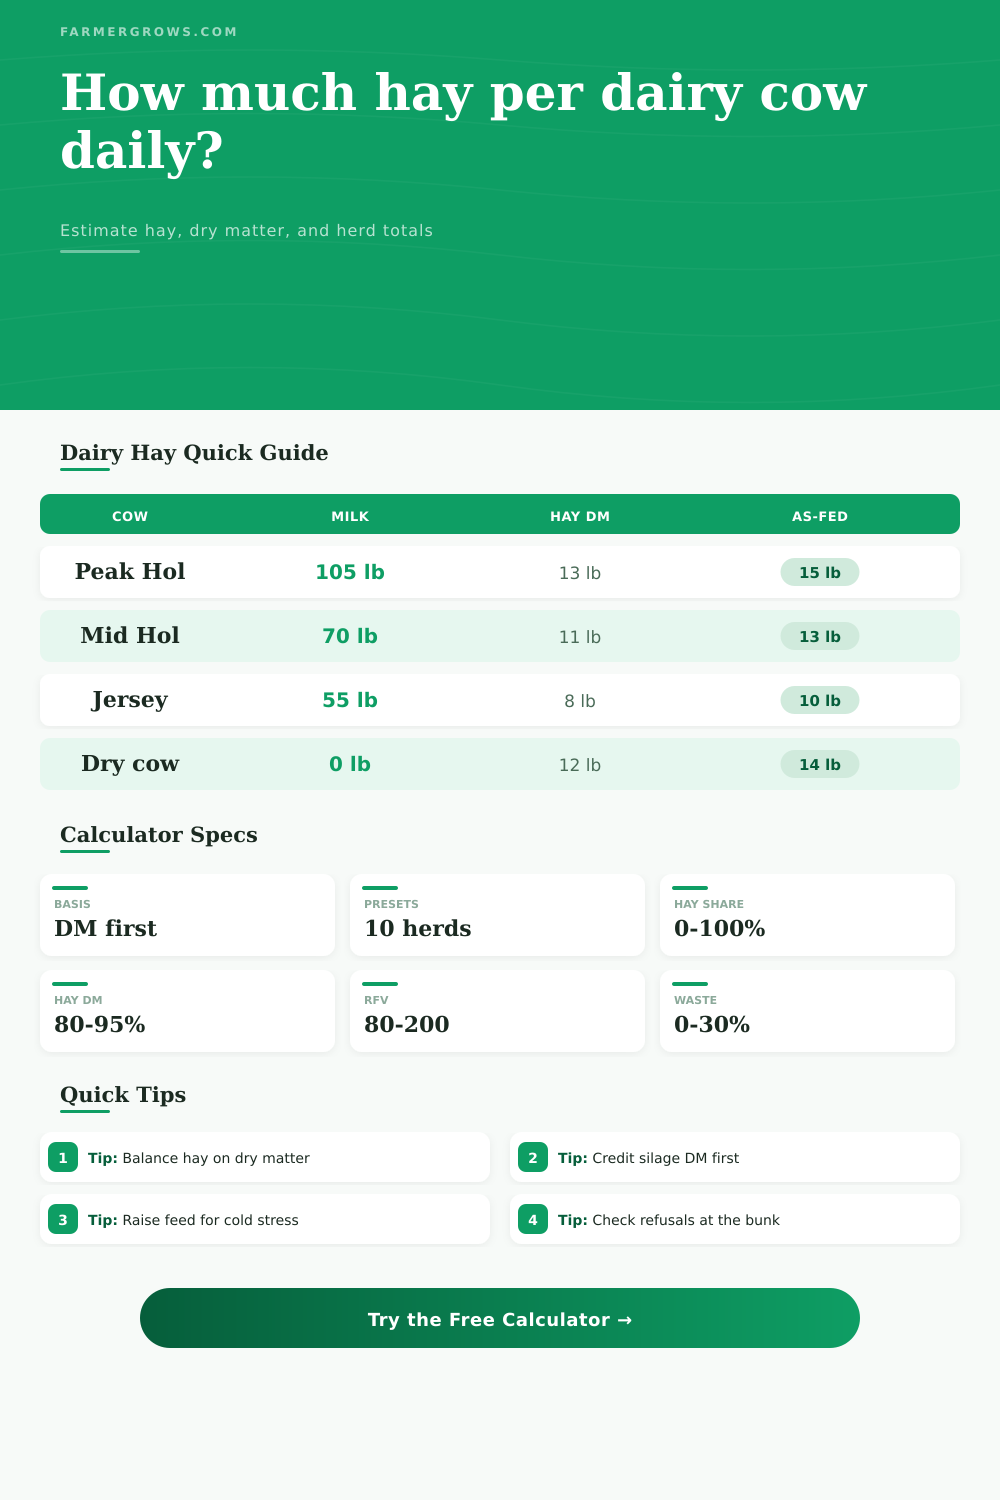
Hay Per Dairy Cow Per Day Calculator
Estimate dairy-cow hay on a dry-matter basis from class, milk production, body weight, ration hay share, hay moisture, RFV, forage credits, bunk waste, weather stress, and herd count.
Start with a named dairy situation, then edit milk, weight, hay share, dry matter, forage credit, bunk waste, weather stress, and herd count for your ration.
Dairy Hay Estimate
Enter a dairy group and calculate to see dry-matter and as-fed hay needs.
Need palatable forage and careful hay inclusion because intake lags behind milk demand after calving.
Often need excellent RFV hay or haylage, with hay pounds limited by total ration energy density.
Usually tolerate a moderate hay share if forage digestibility and effective fiber stay consistent.
Use dry-matter limits and mineral balance; hay can be higher, but intake control still matters.
Works well for lactating cows when RFV is high and leaf loss is low; test minerals for ration balance.
Useful for dry cows and lower groups; lower RFV grass hay can cap intake in high-producing cows.
Often fits mid-lactation and family cow rations, especially when silage provides steady energy.
Credit pasture conservatively because intake shifts with growth stage, rain, heat, and walking distance.
| Dairy group | Typical DMI range | Milk range | Hay planning note |
|---|---|---|---|
| Fresh cow, 0-30 DIM | 2.8% to 3.6% BW | 60 to 100 lb/day | Use high-quality forage and watch refusals closely. |
| Peak lactation cow | 3.4% to 4.2% BW | 85 to 130 lb/day | Hay share usually stays moderate so energy density remains high. |
| Mid lactation cow | 3.0% to 3.7% BW | 55 to 90 lb/day | Good dairy hay can carry more of the forage dry matter. |
| Late lactation bred cow | 2.6% to 3.2% BW | 25 to 60 lb/day | More grass or mixed hay may fit if body condition is watched. |
| Close-up dry cow | 1.8% to 2.3% BW | 0 lb/day | Balance hay with anionic or close-up mineral strategy. |
| Far-off dry cow | 1.7% to 2.1% BW | 0 lb/day | Hay can be higher, but avoid excess energy intake. |
| Forage quality | RFV guide | Calculator factor | Dairy use |
|---|---|---|---|
| Utility hay | Under 100 RFV | 0.90 | Better for dry cows or low milk groups than peak lactation. |
| Fair dairy hay | 100 to 124 RFV | 0.96 | Can work in lower lactation rations with stronger silage support. |
| Good dairy hay | 125 to 149 RFV | 1.00 | Baseline quality for many mixed hay and alfalfa dairy rations. |
| Premium hay | 150 to 174 RFV | 1.04 | Supports better intake in fresh, peak, and high-component cows. |
| Supreme hay | 175+ RFV | 1.07 | Best reserved for groups where milk response justifies the forage. |
| Hay dry matter | Moisture | As-fed hay for 10 lb DM | As-fed hay for 15 lb DM |
|---|---|---|---|
| 80% DM | 20% moisture | 12.5 lb | 18.8 lb |
| 84% DM | 16% moisture | 11.9 lb | 17.9 lb |
| 88% DM | 12% moisture | 11.4 lb | 17.0 lb |
| 90% DM | 10% moisture | 11.1 lb | 16.7 lb |
| 92% DM | 8% moisture | 10.9 lb | 16.3 lb |
| Condition | Factor | Where it fits | Hay management note |
|---|---|---|---|
| Hot weather intake drag | 0.94 | Heat stress or poor cooling | Feed fresh hay and monitor sorting; nutrient demand may still be high. |
| Thermoneutral barn | 1.00 | Comfortable freestall or tie-stall | Use normal bunk waste and refusal targets. |
| Cool damp weather | 1.03 | Wet lots or chilly barns | Small increase covers maintenance and poorer feeder conditions. |
| Cold stress | 1.08 | Below comfort zone | Offer extra dry matter and keep hay dry at the bunk. |
| Severe wind exposure | 1.15 | Open lots, wind, or long cold snaps | Plan more hay and reduce waste with protected feeding space. |
| As-fed hay per cow | 50 cows/day | 100 cows/day | 200 cows/day | 30 days for 100 cows |
|---|---|---|---|---|
| 8 lb/cow/day | 400 lb | 800 lb | 1,600 lb | 12.0 tons |
| 12 lb/cow/day | 600 lb | 1,200 lb | 2,400 lb | 18.0 tons |
| 16 lb/cow/day | 800 lb | 1,600 lb | 3,200 lb | 24.0 tons |
| 20 lb/cow/day | 1,000 lb | 2,000 lb | 4,000 lb | 30.0 tons |
| 25 lb/cow/day | 1,250 lb | 2,500 lb | 5,000 lb | 37.5 tons |
Keep the ration on a dry-matter basis. Compare hay, silage, haylage, and pasture as pounds of dry matter first, then convert only the final hay amount back to as-fed pounds.
Check the bunk against the math. If cows sort hay, leave heavy refusals, or clean up too fast, adjust the waste percentage and ask your nutritionist to review effective fiber.
The sound of a load of hay hitting the floor strike fear into the heart of dairy producers everywhere. It’s October and the cows is eating your winter supply, so it won’t last until after the deep freeze; you find yourself staring at those round bale, wondering what went wrong. That’s when the budget dies: the difference between what you believe the cows are consuming versus what they realy do consume. It would of been a simple calculation, but unfortunatly it isn’t. Enter the hay per dairy cow per day calculator.
Stop thinking about wet weight and start thinking in terms of dry matter; that change of perspective save money. The way most producers purchase hay is with as fed measurements, either tons or by bales. And cows don’t eat moisture. Cows eat dry matter. Every time you feed your cow a wet, heavy bale, you are literal paying it for water weight with no energy value.
Why This Hay Calculator Is Important
This tool will do all the converting for you. Simply type in what your load is and its moisture level and it will adjust the poundage up and down for you. For example, if your hay was ninety percent dry matter, when it was cured, the math come out pretty close to what you bought it for. If you pulled it early when it’s only eighty percent, the tool show how much more physical hay you’re going to have to haul to get the same nutrition. This small distinction add up to a HUGE amount of wasted feed.
It all depends on the stage of lactation. A fresh cow in her first thirty days after calving is in a metabolic crisis. Her rumen hasn’t fully expanded to manage the volume yet, and she’s attempting to make maximum milk. Highly digestible forage that doesn’t fill her up too fast are the ticket. By allowing you to choose the cow class, the calculator take into account what kind of cow it is.
It knows that a Holstein at peak milk production require a different percentage of dry matter than a dry cow in the far-off pen. Give them both the same ratio of grain to hay and don’t be surprised if they don’t get the same results. The baseline intake are adjusted for production goals and body weight so you won’t overfeed your dry cows or underfeed your producers. When the cows gets pushy about getting their milk, quality trumps quantity.
Here’s where Relative Feed Value matters. The higher the hay’s RFV, the more digestible it is and the lower its fiber lignin will be. That’s factored in the calculator. So if your hay being fed is below 100 in RFV (utility hay), then the system knows they’ll be eating less due to increased digestive difficulty. Perhaps you must increase total ration dry matter. It’s a tradeoff and something you want to view on paper first before opening the barn door.
And then there is the environment. Cold weather increase maintenance energy needs. Cows burn calories simply trying to maintain their body temperature when it’s windy and the wind chill is low. The calculator have an option for adding a weather factor. In severe cold, it will nudge the feed recommendation upward several percent. If you don’t take this into account, the cows will decline in condition, leading to reproductive failure down the road.
Conversely, heat stress decrease intake. Nutrient density needs to be balanced against how much the cow can physically stuff into her mouth. Dairy margins have one silent killer, waste. Feeder losses, refusals and waste while bunk sorting can realy add up. You enter a waste percentage into the tool.
Are you losing ten to fifteen percent? That’s common if your bunk management is sloppy. The calculator factors that on top of clean intake. It tells you how much you need to put in the feeder versus what gets to the rumen.
Last but not least, apply it to the whole herd. Take the per-cow-per day estimate above and multiply it by the number of animals in that specific pen. That’s your inventory number. Project it for thirty days and then compare it to your physical stack. If the math indicate you’ve got a need for twenty tons, and there are only fifteen, order some sooner rather than later, when it starts to snow. Trust the numbers the calculator spits out and keep an eye on bunk.