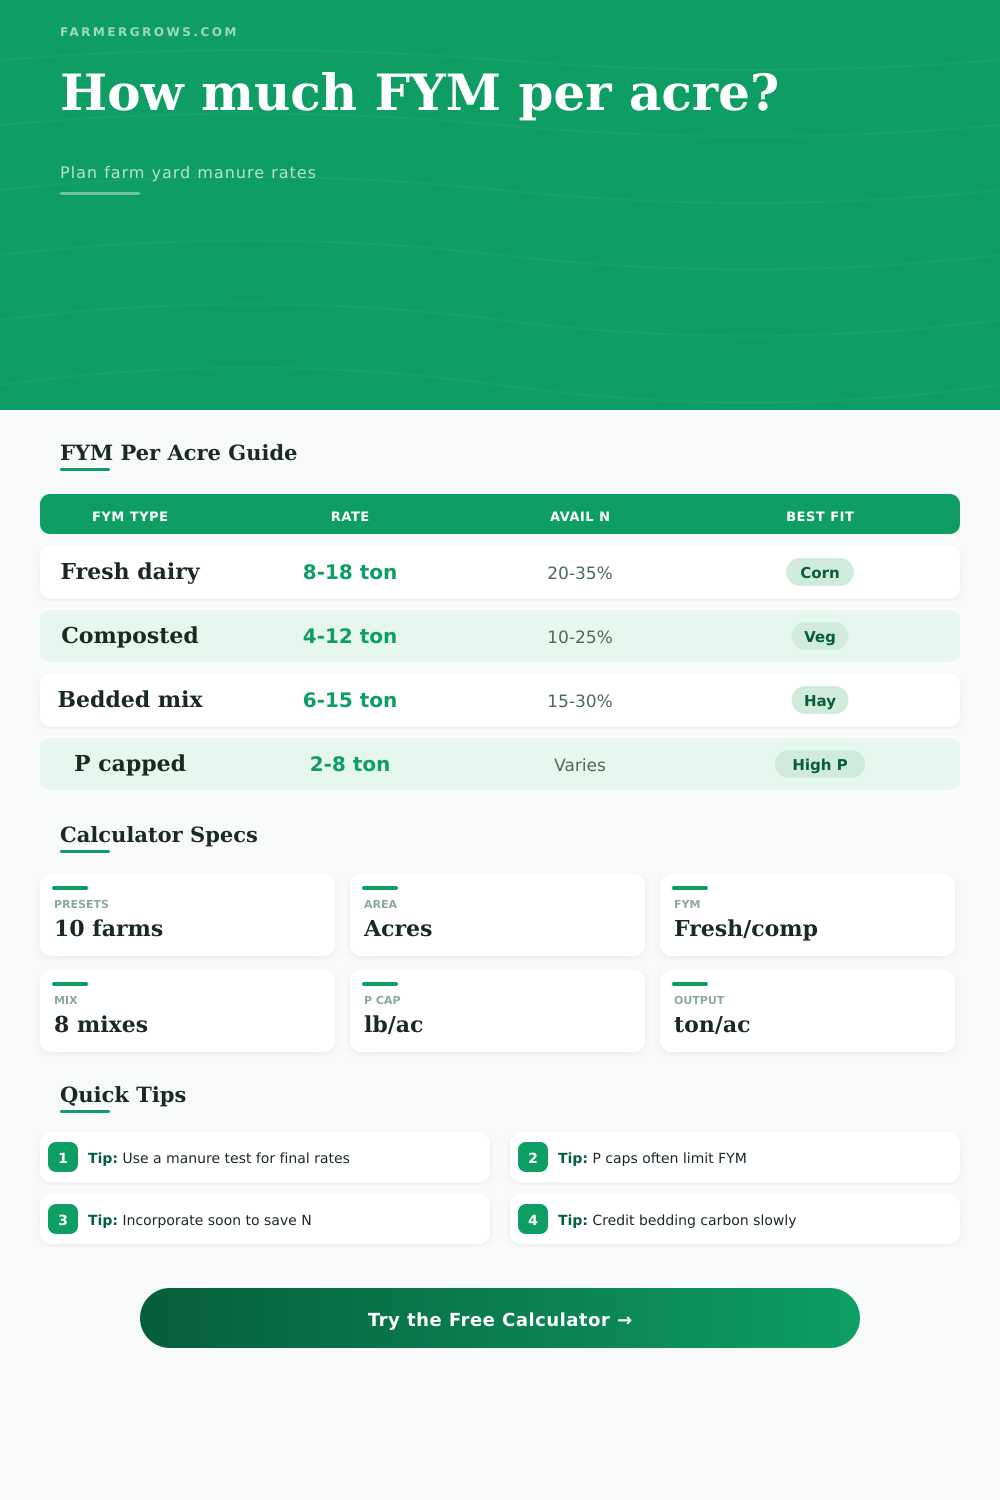
Farm Yard Manure Per Acre Calculator
Estimate FYM spreading rates from acres, fresh or composted material, livestock mix, straw bedding, manure age, moisture, NPK analysis, crop target, N availability, P cap, and incorporation delay.
Start with a named farm situation, then adjust the analysis to match your own FYM test. Presets are planning examples, not a replacement for soil and manure testing.
Farm Yard Manure Application Results
Application plan summary will appear here.
Highest ammonium share and odor risk. Best incorporated quickly before planting where crop timing allows.
Some bedding breakdown has started. N availability is moderate but the pile may still be uneven.
More stable texture, lower immediate N release, and easier spreading across vegetable or hay ground.
Stable organic matter source. Usually applied by P, soil-building, or crop-quality limits.
| Livestock mix | Total N lb/ton | P2O5 lb/ton | K2O lb/ton | Typical moisture |
|---|---|---|---|---|
| Dairy cattle dominant | 10 to 13 | 5 to 7 | 8 to 12 | 65% to 78% |
| Beef cattle deep pack | 12 to 17 | 7 to 11 | 10 to 15 | 45% to 65% |
| Horse stable bedding | 7 to 12 | 3 to 7 | 7 to 12 | 45% to 65% |
| Poultry litter plus beef FYM | 22 to 42 | 20 to 48 | 18 to 35 | 25% to 45% |
| Sheep and goat yard FYM | 14 to 22 | 8 to 13 | 14 to 24 | 30% to 50% |
| Mixed stock yard manure | 10 to 16 | 6 to 10 | 9 to 15 | 45% to 70% |
| Condition | First-year N guide | P2O5 guide | K2O guide | Planning use |
|---|---|---|---|---|
| Fresh and incorporated same day | 25% to 40% | 75% to 90% | 80% to 95% | N-based spring application |
| Fresh and left on surface | 15% to 25% | 70% to 85% | 75% to 90% | Lower N credit, higher loss risk |
| Partly composted FYM | 15% to 30% | 70% to 85% | 75% to 90% | Vegetable, hay, pasture planning |
| Finished FYM compost | 8% to 20% | 60% to 80% | 70% to 85% | Soil building or P-limited fields |
| Crop target | N target lb/ac | P2O5 cap lb/ac | K2O target lb/ac | FYM caution |
|---|---|---|---|---|
| Corn grain | 100 to 160 | 50 to 80 | 70 to 110 | Watch P buildup under heavy rates |
| Corn silage | 130 to 190 | 60 to 100 | 120 to 190 | K demand is often high |
| Winter wheat | 40 to 90 | 30 to 60 | 40 to 80 | Avoid smothering small plants |
| Grass hay | 70 to 140 | 35 to 70 | 120 to 220 | Split applications reduce loss |
| Mixed vegetables | 60 to 120 | 40 to 80 | 80 to 160 | Use mature FYM and food safety intervals |
| Pasture | 40 to 90 | 25 to 50 | 60 to 120 | Keep away from wet areas |
| Wet tons per acre | Loads at 6 tons | Loads at 10 tons | Best spreading note | Nutrient plan check |
|---|---|---|---|---|
| 3 tons/ac | 1 load covers 2.0 ac | 1 load covers 3.3 ac | Light compost or P cap rate | Often P-driven |
| 6 tons/ac | 1 load covers 1.0 ac | 1 load covers 1.7 ac | Maintenance rate for mixed farms | Check N credit |
| 10 tons/ac | 1.7 loads per ac | 1 load per ac | Common cattle FYM rate | Check P cap closely |
| 15 tons/ac | 2.5 loads per ac | 1.5 loads per ac | Soil-building or high-removal crop | Use only if P allows |
Sampling tip: Mix several grab samples from the pile or spreader load before sending FYM for analysis. Stratified piles can change nutrient values from bucket to bucket.
Timing tip: If the rate is N-based, same-day incorporation can preserve enough ammonium N to change the final tons per acre recommendation.
Your soil test is on the counter and your spreader is full, so now what? How will you know if you’re wasting your money, or worse yet: feeding your crops incorrecly? Not knowing makes you feel panicked, right? But wait, first, whoa.
A pile of this black stuff isn’t all alike. Farm yard manure is not. Whether it’s from a chicken house (with sawdust) or a dairy barn (with straw). As it ages, it also changes… Losing some nitrogen to the air while picking up stable carbon in the process. If you put details into the calculator above, it’ll crunch the numbers for you and tell you how much nitrogen are lost by the time you go to plant.
How to Use the Manure Calculator
Don’t be fooled by weight A ton of fresh dairy manure weighs a lot. However, a good portion of that is liquid. This is water weight, water you are moving around to transport nutrients. And that’s why moisture content are important. Dried compost is denser with nutrients per ton then fresh slurry. To adjust for this, the tool takes into account both the moisture percent and number of acres you want to feed. Enter physical volume you’ve got, and the system figures out how much dry matter that is. This helps prevent under-fertilization and stops you from assuming a load of wet stuff will be stronger than it realy is.
Manure doesn’t contain instantly available nitrogen. Some is bound up in organic form and take years to release. Typically only a portion of the test number are credited the first year. Ammonium nitrogen is released if fresh manure is worked into soil at planting time. If you let it sit on top, that nitrogen turn into gas and goes into air. Fertilizer is lost. Delaying (the loss) is what the calculator does. You get more credit if you inject it. Expect lower yields if broadcast and allowed to wait for rain.
Many apply assuming “total test” values. Why did my corn plants has pale leaves in July? They forgot this one. Soil builds up phosphorus more rapidly than crop uptake can remove it. In many fields, phosphorus is high and nitrogen are low. Applying only according to the need for nitrogen could push phosphorus beyond safety levels. The calculator will compare your nitrogen target rate against your phosphorus cap, and alert you if the phosphorus limit is lower then what the nitrogen requirement would demand. It requires that you make a choice: either apply less (and risk unbalanced soil) or top-dress later with synthetic nitrogen. With P-cap, you see that trade-off ahead of time.
Then there’s the complication of bedding. Sawdust or straw will add carbon (to improve soil structure) and dilute nutrients. In contrast, clean scrapings will be more potent than those containing a lot of straw. To get close, you can use livestock mix presets, but analysis is better. For instance, manure from a dairy barn with little bedding won’t behave like some from a stable full of horses with thick shavings. Tables of reference figures give ballparks, but real world piles don’t typicaly meet those standards. Trust your own test results.
It’s not so much that it’s rocket science as logistics: There’s a load capacity (manure), a time window (the season) and a soil test (the agronomic factor). Align those three. Then use the tool to calculate how high you can go (legally and agronomically). Run backwards from how big your truck is. How many loads? On what day? You should of plan accordingly.
When you can, work some in. Test frequently. The pile may look all the same, but the numbers tell truth. Guesswork dissipates anxiety. Drive the spreader with a plan.