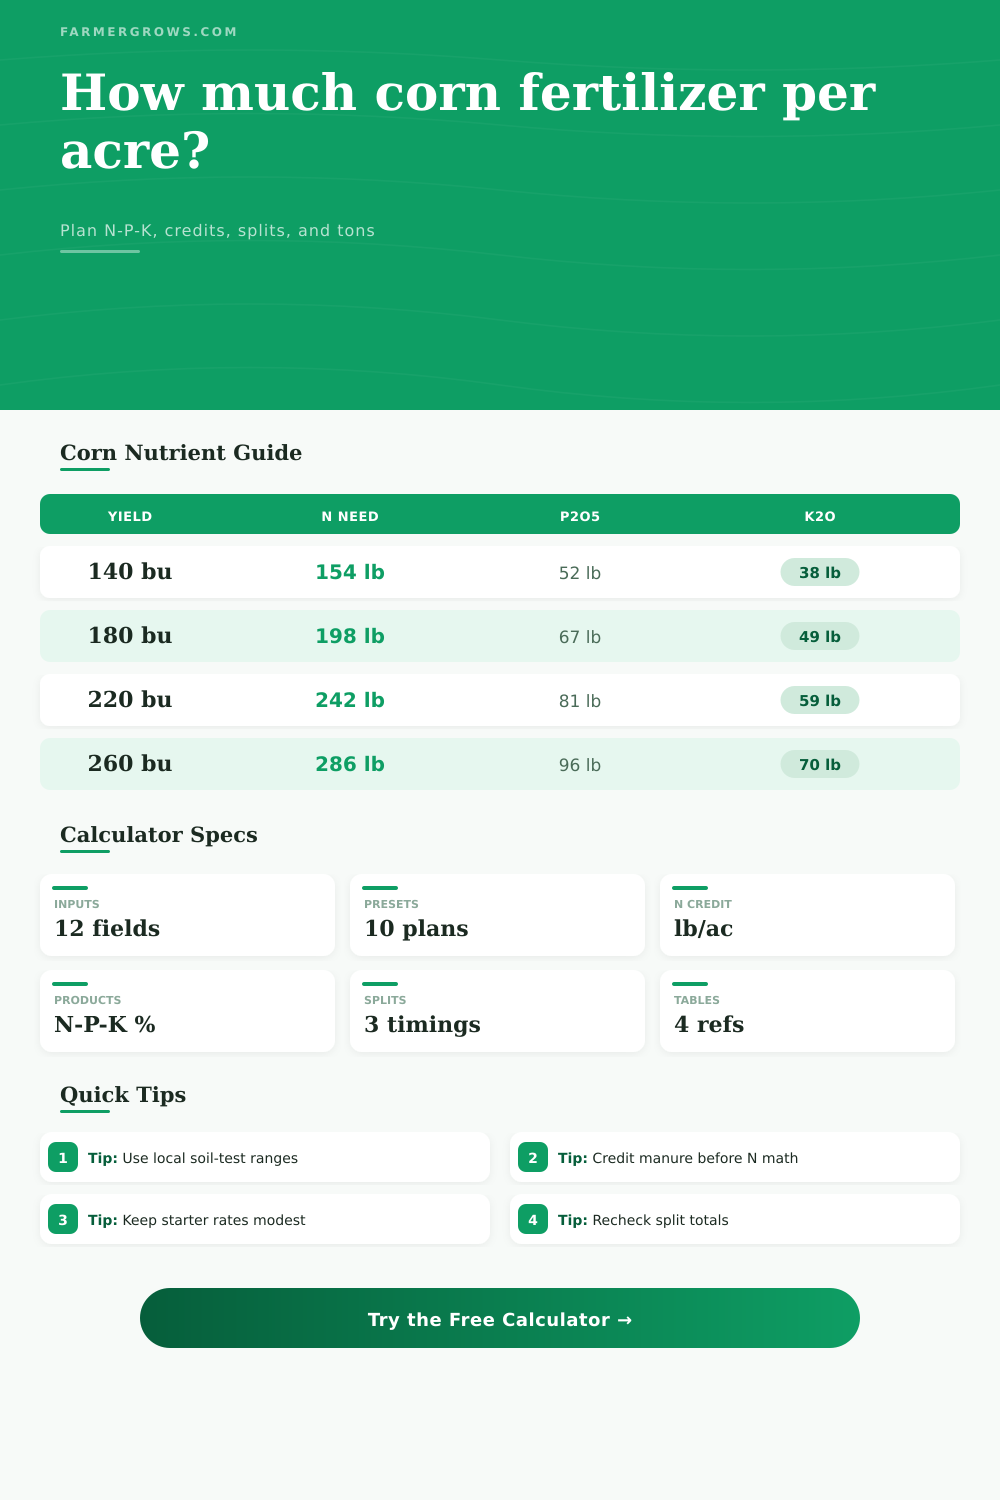
Fertilizer Per Acre For Corn Calculator
Estimate corn fertilizer rate from yield goal, N credits, P and K soil-test class, N-P-K analysis, application efficiency, split timing, acreage, and total product needed.
Choose a corn fertility scenario, then adjust the yield goal, credits, soil-test classes, product analysis, efficiency, acreage, and split timing for your soil-test recommendation.
Useful for sidedress or surface-dribble programs when the main goal is meeting the nitrogen target.
High-analysis dry nitrogen keeps product pounds low, but efficiency settings matter when surface applied.
A phosphorus-driven product that also contributes some nitrogen near planting or in a band.
A balanced product can cover mixed N, P, and K needs, but may oversupply one nutrient.
Corn Fertilizer Result
Fertilizer rate and total product update as the nutrient plan changes.
| Yield goal | Gross N need | P2O5 maintenance | K2O maintenance | Example use |
|---|---|---|---|---|
| 120 bu/ac | 132 lb/ac | 44 lb/ac | 32 lb/ac | Stress-prone dryland corn |
| 160 bu/ac | 176 lb/ac | 59 lb/ac | 43 lb/ac | Moderate grain field |
| 200 bu/ac | 220 lb/ac | 74 lb/ac | 54 lb/ac | Strong rainfed or irrigated field |
| 240 bu/ac | 264 lb/ac | 89 lb/ac | 65 lb/ac | High-yield environment |
| 280 bu/ac | 308 lb/ac | 104 lb/ac | 76 lb/ac | Contest or intensive management |
| Soil test class | P2O5 adjustment | K2O adjustment | Planning intent | Calculator behavior |
|---|---|---|---|---|
| Very low | 1.45 x removal plus 20 | 1.45 x removal plus 30 | Build soil fertility | Raises recommendation above crop removal |
| Low | 1.25 x removal plus 10 | 1.25 x removal plus 20 | Build toward optimum | Moderate build-up recommendation |
| Medium | 1.00 x removal | 1.00 x removal | Maintain production | Uses removal as the target |
| High | 0.50 x removal | 0.50 x removal | Partial drawdown | Reduces product need |
| Very high | 0 lb/ac | 0 lb/ac | No build need | Shows surplus if product supplies nutrient |
| Product or blend | N-P-K analysis | Useful rate basis | Typical placement | Watch item |
|---|---|---|---|---|
| UAN solution | 28-0-0 or 32-0-0 | N requirement | Preplant, dribble, sidedress | Surface loss if not protected |
| Urea | 46-0-0 | N requirement | Broadcast or incorporated | Volatilization and rainfall timing |
| DAP | 18-46-0 | P2O5 recommendation | Starter, band, or broadcast | Extra N supplied with phosphate |
| MAP | 11-52-0 | P2O5 recommendation | Starter, band, or broadcast | Low N relative to phosphate |
| Potash | 0-0-60 | K2O recommendation | Broadcast or strip-till band | Salt concentration near seed |
| Complete blend | 12-12-12 or 19-19-19 | Largest N-P-K gap | Broadcast, band, or starter blend | One nutrient may over-apply |
| Timing split | Starter share | Sidedress share | Base or preplant share | Best fit |
|---|---|---|---|---|
| Mostly preplant | 5% to 15% | 0% to 25% | 60% to 95% | Incorporated dry blends or fall/spring base fertility |
| Balanced split | 15% to 25% | 45% to 70% | 10% to 40% | Common corn N program with planter starter |
| Sidedress heavy | 5% to 15% | 70% to 90% | 0% to 20% | Leachable soils or adaptive N management |
| Starter driven | 35% to 60% | 10% to 40% | 0% to 45% | P-focused banding where rate is not seed-contact sensitive |
Soil-test first: Treat the P and K class outputs as planning math until they are checked against your state or province soil-test recommendation system.
Starter caution: Seed-placed fertilizer safety depends on product, salt index, row spacing, soil moisture, and opener placement, so keep the starter split realistic.
Standing in a cornfield in early May compared to one in July feel different. May is the field of anxiety and potential. Did it make it? Was there enough moisture? Does what I wrote down on paper, my plan from back in February, make any sense out here in the field?
Planning for fertilizer is where hope meets cold, hard math. It is too easy to just throw some nitrogen at it and cross your fingers. Precision agriculture are the difference between profitability and breaking even. Once you enter your soil test results and your desired yield into the calculator, it’ll do the rest. You won’t have to guess about conversions and coefficients.
How to Calculate Fertilizer Needs
Your first true decision is setting a realistic yield goal. Don’t dream big, but look back at your field history and what hybrid are capable of. For example, do you want a hundred and forty or two hundred bushels an acre? That makes a huge difference in how much nitrogen the system will require. Each bushel of corn take up certain amounts of nutrients from soil. Replace what you take out. By default, the calculator looks at standard rates of nutrient removals to give you a rough picture of what that need might be.
This is before any credit get applied. Now that’s the base line; that’s where the N credit input comes into play. Many growers fail to deduct what is already present in the soil. You planted soybeans last year, followed by corn this year? There is still some residual nitrogen fixed by those legume in the ground. You spread on manure last fall? That contribute to the total. Failing to take these credits into account results in over-applying nitrogen. That’s wasted money. And it can lead to environmental runoff.
The tool lets you enter these offset inputs right there. Your net requirement is lowered… Meaning your budget stay intact. It doesn’t work for nothing. Over-application are the silent killer of farm margins.
The other two elements, phosphorous and potassium, are a bit more complicated because they’re not like nitrogen. Unlike nitrogen, which will leech out in the rain, these don’t. That’s why the equation is based off the class of your soil test. Your class tells you whether you need to maintain your level (if your soil test indicates you’re in the medium class, for instance) or build (and the calculator bumps the recommendation higher than normal to get you into the sweet spot). Phosphorous is also an expensive item to purchase; you don’t want to purchase something you don’t realy need.
The link between the nutrient need and what goes into the tank or bag is product analysis. For example: you may require a hundred and fifty pounds of nitrogen. With a thirty-two percent solution of UAN, you will need to apply close to half a ton of liquid to achieve this. Depending upon your solution strength, the calculator show how many pounds of product it needs per acre. And it can be split up for use.
Many farmers starts with a portion put down in a starter band at planting time and another applied as a sidedress later. This spreads their risk. If it’s wet in the spring and nitrogen leaches off, they’ll have the sidedress application yet to come. If it’s dry in summer, the starter got them through.
The last variable is efficiency. Nothing is a perfect 100% in practice. Not all of applied nitrogen will stay as nitrogen; some phosphorus is lost to the soil being “fixed” by the soil, etc. This is taken into account with the efficiency percentage. You may have a higher or lower number depending on whether you’re injecting your manure vs. You could also apply urea to the surface without mixing it in. This means you’ll adjust that percentage so you’re only putting down what the crop require.
It’s not all about how much you spray. This is laid out in the reference table found on the page, which shows the scale of nutrient demand relative to yield. This can serve as a good check to determine whether or not your numbers makes sense. If you’re vastly off from the table for your yield goal, then double-check your input. It’s also a balance: how much fertilizer should I apply? Too little, and yields suffer. Too much, and I waste money (and pollute the environment).
This tool will help you figure out your sweet spot. It can turn vague intentions into hard-and-fast numbers. Then it’s merely a matter of carrying out the plan. Load up the rig. Calibrate the spreader. Go to work.
First, however, we must know where to aim. That’s where the math come in.