Strawberry Plants Per Acre Calculator
Estimate strawberry plant population, crown or plug order size, row length, planted-acre efficiency, runner-adjusted stand, and harvest range for matted rows, hill beds, plasticulture, and tunnel blocks.
Use net planted acres when ordering strawberry crowns or plugs. Bed centers already include the aisle between beds, while the planted-area factor removes headlands, roads, cull space, irrigation headers, and unplanted field edges.
Strawberry Acre Population Results
Review the starter plant count, order quantity, row footage, acre density, runner-adjusted stand, and harvest range before placing crown or plug orders.
| Bed center | 12 in plants, 1 row | 12 in plants, 2 rows | 15 in plants, 2 rows | 18 in plants, 1 row |
|---|---|---|---|---|
| 36 in | 14,520/acre | 29,040/acre | 23,232/acre | 9,680/acre |
| 42 in | 12,446/acre | 24,891/acre | 19,913/acre | 8,297/acre |
| 48 in | 10,890/acre | 21,780/acre | 17,424/acre | 7,260/acre |
| 54 in | 9,680/acre | 19,360/acre | 15,488/acre | 6,453/acre |
| 60 in | 8,712/acre | 17,424/acre | 13,939/acre | 5,808/acre |
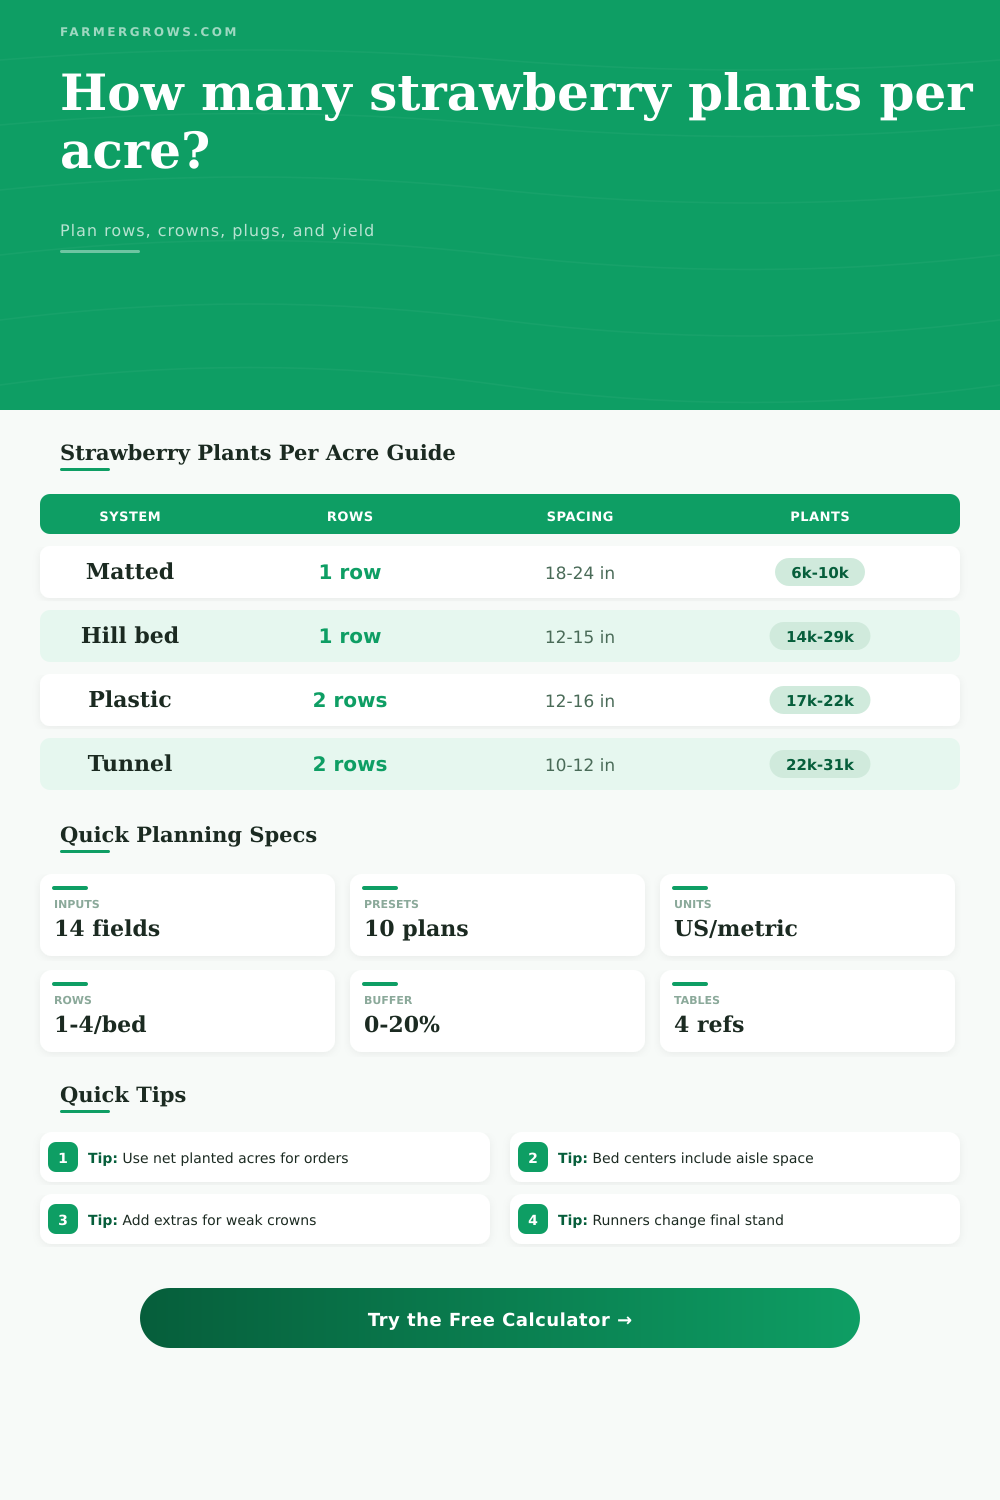
| Production system | Typical centers | Plant spacing | Rows per bed | Starter strategy |
|---|---|---|---|---|
| Matted row June-bearing | 36 to 48 in | 18 to 24 in | 1 | Order fewer crowns as runners fill |
| Hill system | 36 to 48 in | 12 to 15 in | 1 | Clip runners and manage individual crowns |
| Annual plasticulture | 48 to 60 in | 12 to 16 in | 2 | Use plugs or large crowns with low gaps |
| Day-neutral beds | 42 to 54 in | 10 to 14 in | 2 | Dense rows with regular runner removal |
| Nursery propagation | 30 to 42 in | 8 to 12 in | 1 to 2 | High population for runner production |
| Area scale | Square feet | Hectares | At 17,424/acre | At 21,780/acre |
|---|---|---|---|---|
| 0.10 acre | 4,356 | 0.040 ha | 1,742 plants | 2,178 plants |
| 0.25 acre | 10,890 | 0.101 ha | 4,356 plants | 5,445 plants |
| 0.50 acre | 21,780 | 0.202 ha | 8,712 plants | 10,890 plants |
| 1.00 acre | 43,560 | 0.405 ha | 17,424 plants | 21,780 plants |
| 2.00 acres | 87,120 | 0.809 ha | 34,848 plants | 43,560 plants |
| Planning factor | Conservative | Typical | Strong | How to use it |
|---|---|---|---|---|
| Usable planted area | 70% | 85% | 95% | Lower it when fields have wide headlands or service lanes |
| Establishment survival | 80% | 90% | 96% | Lower it for delayed planting, heat, or weak bare roots |
| Order buffer | 5% | 10% | 20% | Use extras for gaps, weak plugs, and replacements |
| Row end loss | 2% | 5% | 12% | Accounts for row breaks, valves, and odd field edges |
| Runner fill | 0% | 25% | 75% | Use mainly for matted-row systems |
For ordering: Base crown and plug purchases on starter stations, survival, and buffer. Do not add runner fill to the order unless daughter plants are purchased separately.
For layout: Measure bed centers from bed center to bed center. That spacing includes the aisle, wheel track, drip-bed shoulder, and picking access.
STRAWBERRIES are among the crops whose planting demands some math. Because so much excitement comes before common sense, someone’s thinking: Oh, I’ll have a patch of red goodness. And then there are all these little plugs (or crowns) to plant. Will they fit? How many can you get in? To get the most output, you need to think about airflow and the growth of runners, too, get them packed in just right so each square foot of earth is making money for you.
Plant population math is straight forward; however, unless you account for bed geometry you run the risk of getting it incorrect. When most growers inquire about plant population (i.e., How many do I need per acre?) they are misinformed. An acre of planting space isn’t equal to an acre of field. Drive lanes, irrigation headers, headlands, and gaps around valves is all areas that never contain a single root.
How to Count Your Strawberry Plants
The calculator above takes the guesswork out of this math. Just plug in the width and length of your field(s) along with the percentage of that field that can be used for growing product. This eliminates having to guess at how much “non-productive” space should of been deducted. Making this adjustment alone can result in a difference of thousands of units in your plant order.
Don’t fall into the trap of thinking gross acreage equals net planted. Treating gross acreage as net planted area lead to suffocated canopy or bare patches, neither of which yields premium fruit.
Spacing strategy depends on your production system. In matted row systems, widely spaced mother plants is expected to be filled in by their daughters. To do this, you plant fewer starters; sometimes only six or ten thousand per acre. And let nature do its thing. This approach requires a lower up-front cost, a longer wait and more attention to establishing a clean crop.
By contrast, hill systems require a higher starting plant number and feature aggressive clipping of runners to maintain space among crowns. Because you can exert closer control of disease pressure and plant vigor, this one’s a little harder up front, but offers more control overall. Tunnel and plasticulture systems fall somewhere in-between. Using moderate density and raised beds improves root health and drainage.
After you select a system, it’s all about physical layout. You need to know how far apart the centers of the beds are. This distance includes the width of the aisles, which is the key issue for machinery access. And how much space do you have between plants within each row? Squeeze them together to reduce the number of plants you need. However, your picker might not fit between rows to work easy. Your tractor might not even be able to make that turn. Those little details add up quickly when multiplied across hundreds of feet of row. See how they compound in the reference table on this page.
You must also consider buffer and establishment survival, and take into account what happens when things don’t go exactly as planned (which never happens). There’s always some loss at the field edge; some of those plugs won’t root; some of those crowns will dry out. You order 10 percent more than you need because of this, but if it’s late in the season, or you’re planting something weak, raise that number. With the tool, you can tinker with all those numbers so you don’t come up short two weeks post-planting.
It also computes how many plants you might expect at the low end and the high end. This gives you a ceiling on possible income before you even put spade to ground, which helps make your revenue projection realistic. To understand this, we need to know what we are measuring. It’s not the number of plants; it’s the density of photosynthetic area that you’re purchasing. Too few per square foot and you’re wasting your soil resources. Too many and you’ve invited fungal issues which love shady, humid canopies. There is a fine line here but it can be managed.
Begin with market demand. Need an early harvest? Hill systems might win. Matted row or hill systems may serve you better. Limited labor to manage runners? Maybe matted rows will do. But here’s what we know: What looks good on paper isn’t necessarily real. The ground speaks for itself. Running the numbers before you dig in transforms your hunch into a plan.
It stops being a question of “How many crowns should I order?” and becomes a matter of fact: How many plants does it take to fill an acre? Knowing that number makes all the difference, not only in your harvest timing but also in your cash flow. You create the field of your dreams, not the one you fell into by chance.