Corn Stalks Per Acre Calculator
Estimate corn stalks per acre from row spacing, in-row plant spacing, stand counts, seed drop, germination, emergence, lodging, harvest survival, ears per stalk, and field area.
Pick a field pattern, then adjust row width, spacing method, stand-count section length, emergence, doubles, skips, lodging, ear set, and field acreage.
Corn Stand Results
30-inch grain corn with 6.4-inch in-row spacing.
| Row spacing | 1/1000 acre row length | Plants counted for 30,000/ac | Use note |
|---|---|---|---|
| 15 in rows | 34 ft 10 in | 30 plants | Longer count strips smooth out skips in very narrow-row systems. |
| 20 in rows | 26 ft 2 in | 30 plants | Useful for narrow grain or silage fields where canopy closes quickly. |
| 22 in rows | 23 ft 9 in | 30 plants | Common in some northern corn regions and beet rotations. |
| 30 in rows | 17 ft 5 in | 30 plants | Most common quick stand count length for grain corn. |
| 36 in rows | 14 ft 6 in | 30 plants | Often used for lower density dryland or older equipment setups. |
| Row width | In-row spacing | Approximate stalks/ac | Field fit |
|---|---|---|---|
| 30 in | 7.0 in | 29,878 | Moderate population for variable soils or lower water supply. |
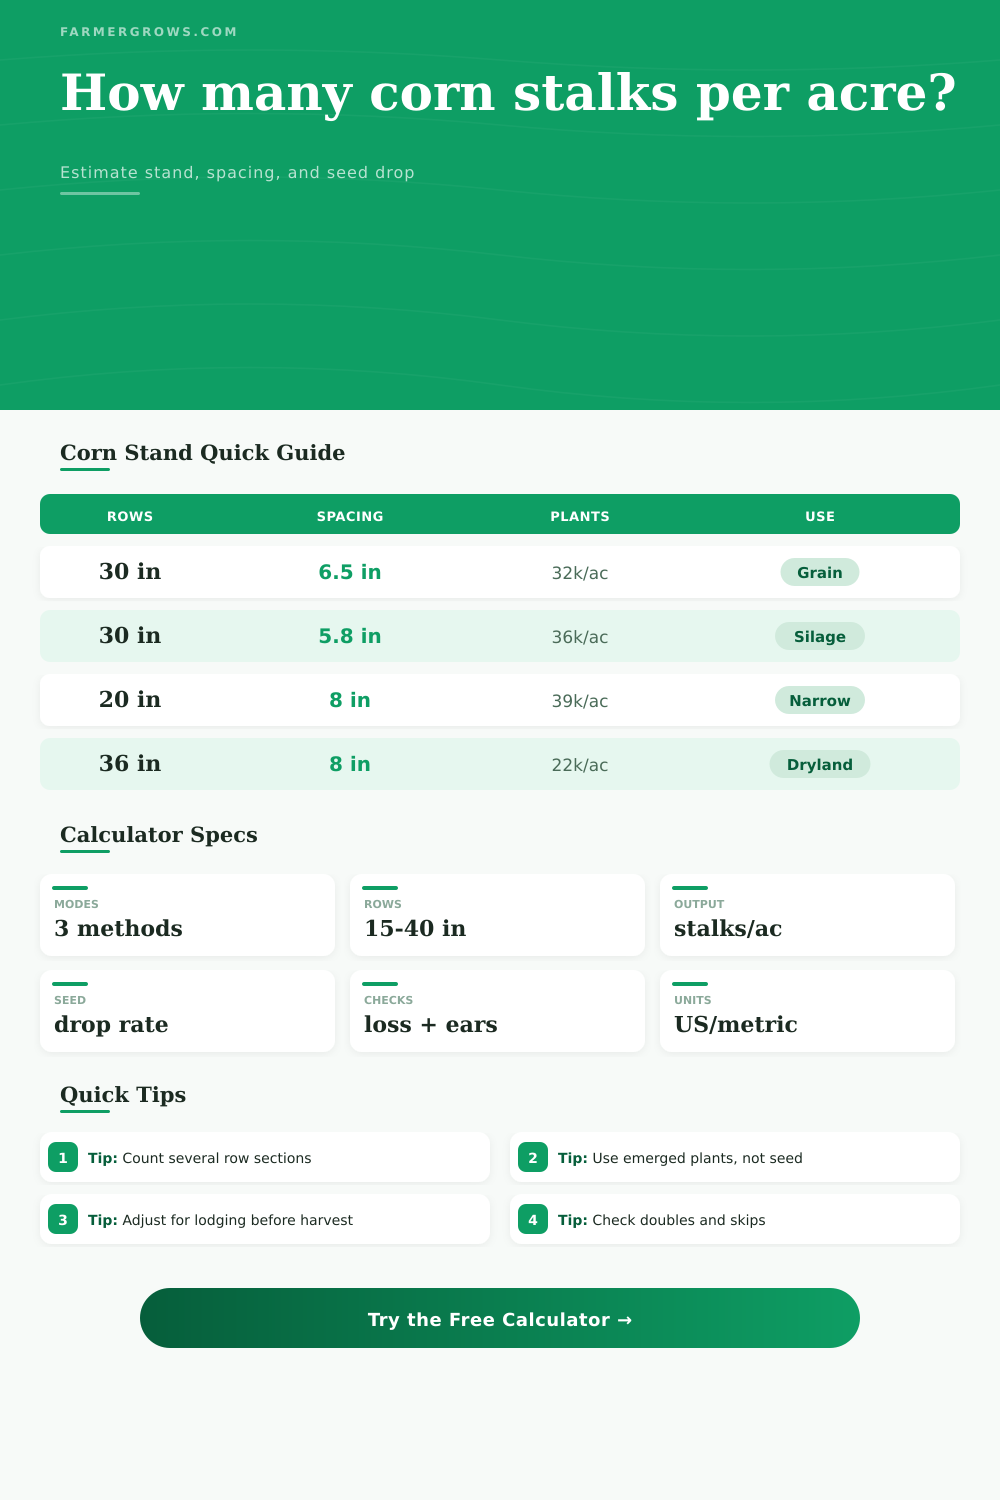
| 30 in | 6.5 in | 32,166 | Common grain corn range under balanced fertility and moisture. |
| 30 in | 5.8 in | 36,062 | Higher silage or high-yield grain target where standability is strong. |
| 20 in | 8.0 in | 39,204 | Narrow rows allow wider in-row spacing at a high population. |
| 36 in | 8.0 in | 21,780 | Lower density option for dryland stress or wide-row cultivation. |
| Corn use | Typical final stand | Seed drop consideration | Management check |
|---|---|---|---|
| Dryland grain corn | 18,000 to 28,000 plants/ac | Lower drop protects moisture in stress-prone soils. | Watch ear set and barrenness after heat or drought stress. |
| Irrigated grain corn | 30,000 to 36,000 plants/ac | Drop enough seed to cover germination and field emergence loss. | High fertility and standability matter as population rises. |
| Corn silage | 32,000 to 40,000 plants/ac | Silage often tolerates a higher stand than grain harvest. | Check stalk quality, moisture, and harvest window. |
| Organic cultivated corn | 24,000 to 32,000 plants/ac | Row width may be set by cultivation equipment. | Account for weed competition and stand thinning during cultivation. |
| Research or hybrid plots | By protocol | Use exact row length and planted rows for each plot. | Keep alleys, border rows, and missing hills out of stand math. |
| Final stand goal | Germination x emergence | Seed drop per acre | Quick interpretation |
|---|---|---|---|
| 28,000 plants/ac | 90% | 31,111 seeds/ac | Often enough for lighter soils or lower yield environments. |
| 32,000 plants/ac | 87% | 36,782 seeds/ac | Common when cold soil, crusting, or pest pressure reduces emergence. |
| 34,000 plants/ac | 92% | 36,957 seeds/ac | Strong planting conditions reduce seed needed for the same final stand. |
| 36,000 plants/ac | 88% | 40,909 seeds/ac | High populations need careful singulation, residue managers, and fertility. |
| 40,000 plants/ac | 90% | 44,444 seeds/ac | More common in silage or very high-yield narrow-row systems. |
Count real plants. Walk several representative spots and count emerged or harvestable stalks, not seed spacing marks. Average the counts before making a replant or yield call.
Separate stand and quality. A field can have enough stalks per acre but still lose yield from long skips, doubles, weak roots, or lodging-prone areas.
To determine true state of your field, simply calculate how many plants per acre you’re looking at. The planter drops them with accuracy, but sometimes it doesn’t look that way on the ground. One number can make all the difference in a good yield versus a compromised yield.
Every grower has their target number, say thirty thousand for grain corn; thirty six thousand for silage. But until you get out there walking those rows, it’s nothing more than a target. Input your row spacing and emergence rates into the calculator and let it do the math. No guesswork are required for conversions, and the answer will be right there for you to see: what you’ve got to work with.
How to Count Your Corn Plants
Plant stand is not the same as seed drop. Even if you drop thirty-five thousand seeds, there are fewer then that after soil conditions get done with them. Numbers decreases because of insects, crusting, uneven moisture, and planting depth. With this tool, you separate out field emergence from germination. And why does that matter? The cause of poor stand may have been an improper planting job versus a bad seed lot. High germination, poor emergence mean it was environmental or mechanical. You can fix it next time. Poor seed means it’s the seed; you’ll want a new seed source. Know where the loss happened so you won’t do it again.
Counting accuracy matter too, specifically the spacing of what you count. Many farmers count by measuring a set distance along a row. One-thousandth of an acre is roughly a 17-foot-long swath in thirty-inch-wide rows (which is why that’s the standard). But accuracy depends on consistency. You can’t count one perfect section and then not bother to account for a skip ten feet over, your data is skewed.
You enter your actual plant counts from several section, or the average number of plants per foot in-row into the calculator. Often, average in-row tell the story best because it reveals how consistent things are. Uniformity leads to higher potential. A field with a count of thirty-two thousand on average may well perform worse than another field whose average was thirty thousand, but which was evenly planted rather than having long skips and some doubles. Crowded areas means competition for resources, while skipped areas waste valuable space.
As time moves forward, your emergence determines your actual plant stand. Lower populations mean less lodging. Pushing population too hard means less strength in the plant, such as less nitrogen and a weaker stalk. This causes the wind to thin the crop. That’s why there’s a lodging factor in the calculator. You should of faced the consequences. Broken stalks reduce your actual yield by a lot if you lose 10 percent of the stand prior to harvest. It is not just stalks, but also ears that are harvestable. And not all stalks is equal to an ear. Under stressed conditions, a barren stalk adds nothing to the bin, only weight to the field.
Then there’s another layer that people tend to overlook: residue management. It calculates the amount of dry stover on each plant. That links this year’s yield to how it will impact next year’s planting conditions. More plants = more residue, which aids in soil health but may impede seed-to-soil contact. You have to balance the mechanical challenge of getting a clean stand next spring against the carbon benefits.
Compare tables (reference) to see at-a-glance what’s normal within the industry. See that you can get comparable density from narrower rows with greater space between rows? That affects how the canopy close, which in turn affects things like light interception and weed suppression. These are small details, but they is important.
Manage expectations for corn counting. You can’t change what’s already in the ground. But you can learn from it. If you’re making decisions about adjusting fertilizer rates, or deciding where to replant a thin spot, accurate numbers drives better decisions. To get accurate numbers, walk the field. Count the actual plants, not the seeds. Adjust for doubles and skips. Let the math tell you the truth. Then make your plan based off what’s really standing there. Your hopes don’t mean anything to the ground; it only responds to what you do next.