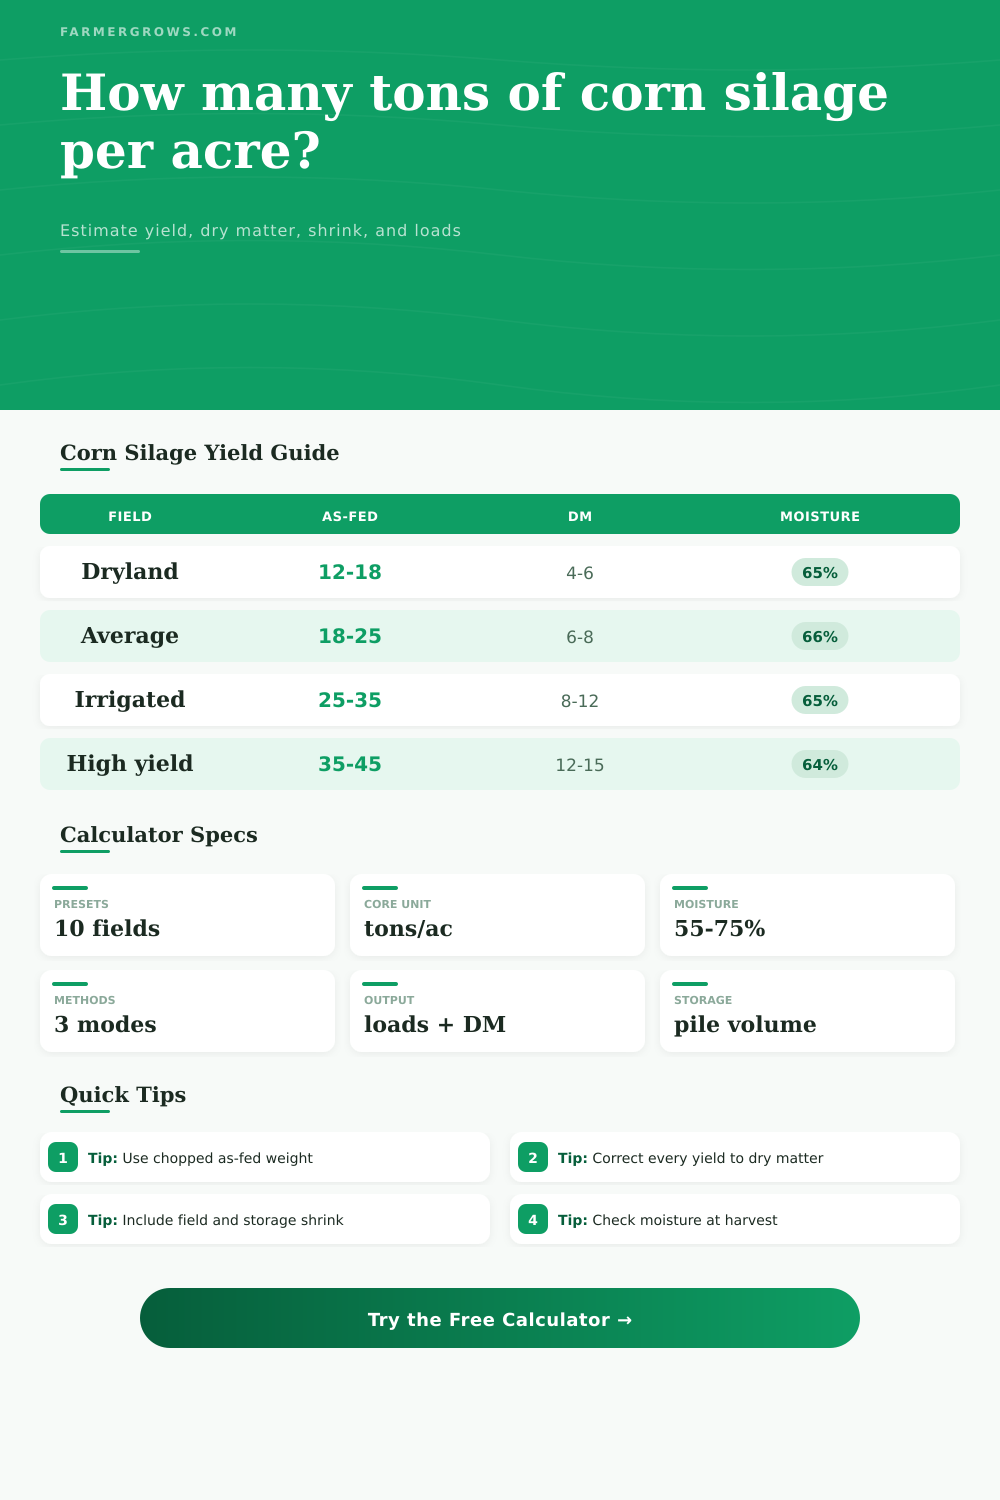
Corn Silage Tons Per Acre Calculator
Estimate corn silage tons per acre from direct yield, stand samples, or chopper loads, then convert moisture, dry matter, harvest recovery, shrink, loads, and packed storage volume.
Choose a harvest pattern, then adjust acres, yield method, plant sample, chopper loads, moisture, recovery, storage shrink, and packed density to match the crop being chopped.
Silage Yield Estimate
Corn silage yield and storage summary.
| Harvest moisture | Dry matter share | DM tons from 25 as-fed tons | Storage note |
|---|---|---|---|
| 58% | 42% | 10.5 DM tons/ac | Often drier than ideal for tight packing in bunkers and piles |
| 62% | 38% | 9.5 DM tons/ac | Fits many bunker or pile systems when chop length and packing are good |
| 65% | 35% | 8.8 DM tons/ac | Common target for many silage harvest plans |
| 68% | 32% | 8.0 DM tons/ac | Usually wetter; watch seepage and fermentation management |
| 72% | 28% | 7.0 DM tons/ac | Wet silage adds as-fed tons without adding the same feed dry matter |
| Method | Best input | Main formula | Use note |
|---|---|---|---|
| Direct tons per acre | Field history or weigh wagon | tons/ac x harvested acres | Fastest planning method when the yield value is already representative |
| Stand count and plant sample | plants in 1/1000 acre and fresh plant weight | plants/ac x plant lb / 2000 | Good before harvest if sample plants match the field average |
| Load tickets | loads and average net load weight | total net tons / chopped acres | Best after harvest when scales or reliable wagon weights are available |
| Harvest map check | calibrated monitor yield | map tons divided by acres | Calibrate against actual weights before trusting field zones |
| Storage condition | Packed density | Typical shrink | Planning note |
|---|---|---|---|
| Tightly packed bunker or pile | 44 to 50 lb/ft³ as-fed | 5% to 8% | Requires fast filling, thin layers, enough tractor weight, and good cover |
| Normal covered bunker | 38 to 44 lb/ft³ as-fed | 8% to 12% | Useful default for many farms when feedout pace is steady |
| Loose pile or slow feedout | 32 to 38 lb/ft³ as-fed | 12% to 18% | Air exposure and heating can remove feed value quickly |
| Bagged silage | 36 to 46 lb/ft³ as-fed | 6% to 12% | Density depends on bagger setting, chop length, and crop moisture |
| Example | As-fed yield | DM yield at 65% | Usable tons after 10% shrink |
|---|---|---|---|
| 20 acre dryland field | 15 tons/ac | 5.25 DM tons/ac | 270 usable tons |
| 40 acre average dairy field | 24 tons/ac | 8.40 DM tons/ac | 864 usable tons |
| 65 acre irrigated block | 32 tons/ac | 11.20 DM tons/ac | 1872 usable tons |
| 12 acre small beef field | 18 tons/ac | 6.30 DM tons/ac | 194 usable tons |
Compare fields on dry matter. As-fed tons rise when the crop is wetter, so dry matter tons per acre is the better way to compare hybrids, fields, and harvest dates.
Use actual weights when possible. Stand samples are useful before chopping, but truck scales, wagon scales, or calibrated harvest data give the cleanest tons-per-acre result.
When standing amid high corn stalks it’s difficult to estimate your feed budget. Yes they are big, but it’s tough to visualize volume of this crop. It could be a good tonnage or a poor tonnage crop. And many times it comes down to water content, which is something you cannot easily see.
To feed livestock through the winter months you’ll need to get beyond just seeing bulk. Estimate your corn silage tons per acre by converting to dry matter. When you put in an estimate for yields and dimensions of fields the calculator do the rest (above). No more guesswork with coefficients. The beauty is knowing what the inputs represent.
Plan Your Feed With Numbers, Not Guesses
The single largest variable in silage planning is moisture. Silage harvested at 70% moisture equals one ton of silage, but how much actual feed is that? Three quarters of it is water. And you’re hauling water to feed cattle.
First off, don’t use as-fed weight; use dry matter yield. That’s where a lot of folks mess up. Dry matter doesn’t fluctuate based off weather conditions. Gross weight does. When you enter your guessed moisture percentage, that tool converts those gross weights into a number representing usable nutrition. And it factors in loss from the chopper to the feed face.
Rarely will harvest recovery be 100%. Some ferment in storage, some get mashed in mud, some remain in headlands. Less feed = less cost You can tinker with the amount that gets lost due to storage shrink. It’s tiny, but important.
If it is not packed properly, such as being too loose or exposed to air, you can expect a loss of 15 percent or more due to spoilage or heat. This affects how much of crop you have left at the end of fermentation. Tight packing + decent cover may result in just 5 percent loss, whereas a sloppy job might lose 20 percent. That will change your planting acreage to reach desired inventory levels.
How will you get all that into storage? The calculator figures that too. How many truck loads does it take to fill it? What’s the volume of everything packed inside? Use that information to plan your harvest timing.
Filling silage storage is a race against time. Each layer must be loaded by a tractor with enough weight to force out air before fermentation sets in. If you run fewer loads than there are spaces in the storage, the silage settle too much and creates air pockets. Those pockets start spoiling.
Before you go and start chopping, consider the trade offs. Sounds nice, a bigger yield per acre. It might not work unless moisture is right. Often times the higher yielding stalks has greater water content (heavier) and dilute energy density in the ration. A moderate yield at just the right moisture is better than crazy high yields that won’t pack well because they’re too wet.
On the same page is a reference table showing where the dry matter yield falls with moisture change. Follow that guidance for setting your expectations.
Silage planning is all about managing risk. Don’t plant more than you need, but have enough to see you through the season. Adjust for storage shrink, harvest loss and a little cushion in case things don’t go as planned. Then add it up and you have a clear view of what’s coming this winter. A visual guess becomes a real plan.
It is not just about tonnage, but also the days of feed. How many times have you wished you could of count on something other than the bunker face to connect you to summertime? Trust the process… start with the numbers.