Bushels Of Corn Per Acre Calculator
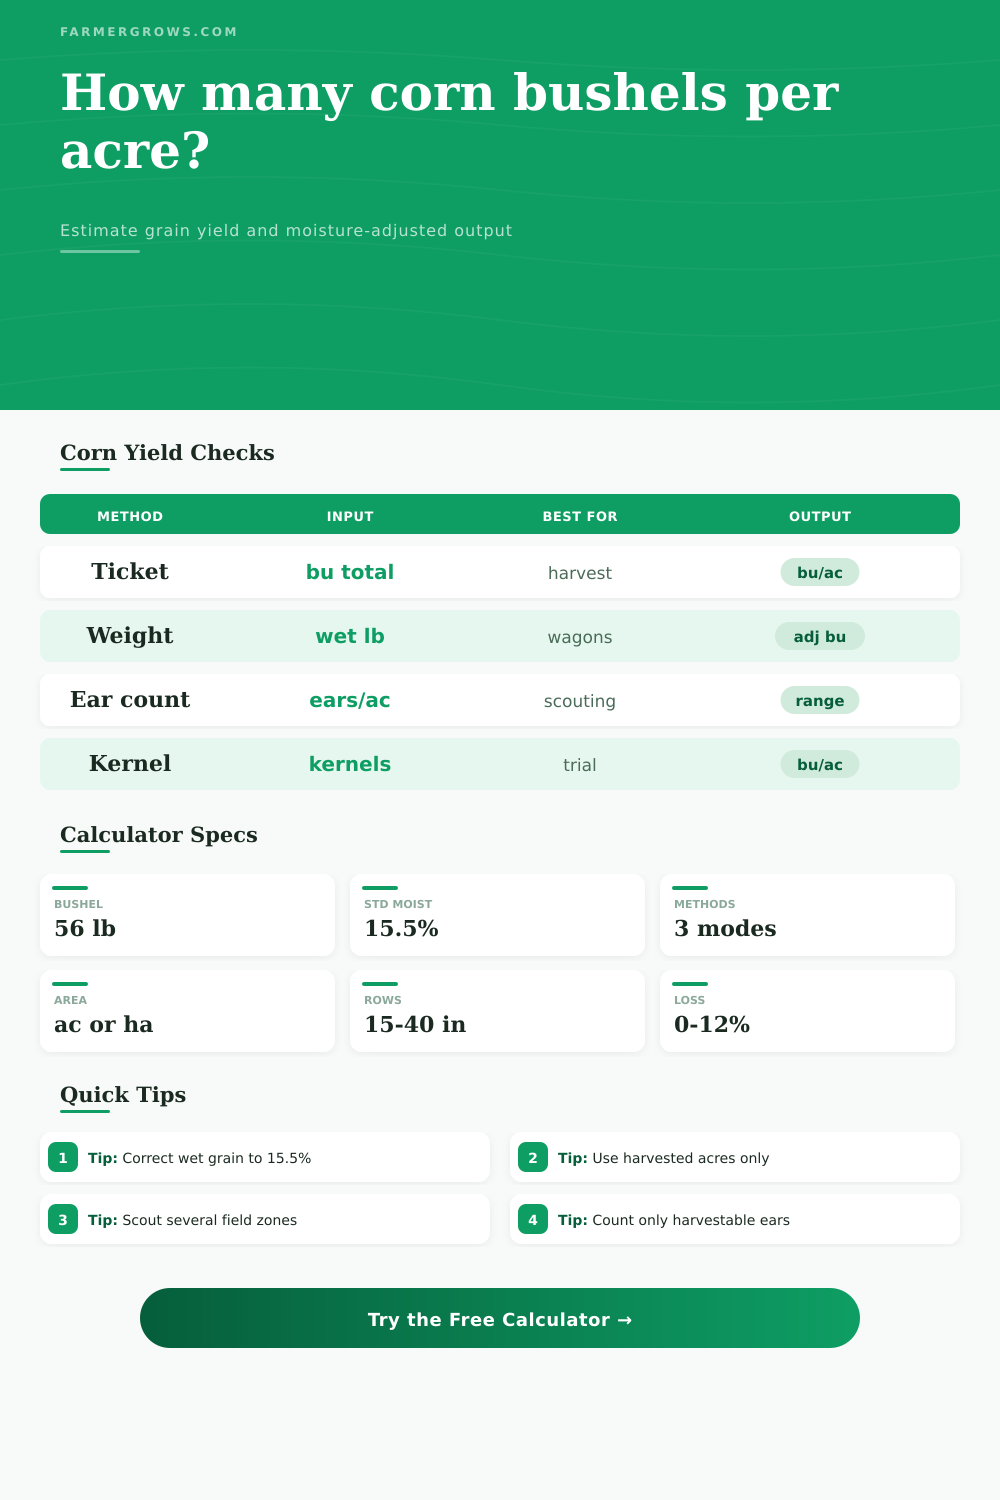
Estimate corn grain yield by acre from harvest tickets, wet grain weight, or pre-harvest ear counts with moisture correction, field loss, harvested-acre, and kernel-size adjustments.
Choose a realistic grain corn situation, then edit the harvested acres, moisture, stand, kernel count, shrink, and field loss values for your field or test strip.
Corn Yield Estimate
Your adjusted corn yield is ready.
Corn moisture correction example
| Harvest moisture | Standard bushel factor from wet weight | Wet pounds per standard bushel | Use in calculator |
|---|---|---|---|
| 15.5% | 1.000 | 56.0 lb | No moisture correction beyond shrink or handling loss. |
| 18% | 0.970 | 57.7 lb | Moderate correction for normal early harvest corn. |
| 22% | 0.923 | 60.7 lb | Useful for wet fall harvest and dryer planning. |
| 26% | 0.876 | 64.0 lb | Large correction; verify moisture samples and tare weights. |
Kernel-count yield guide
| Crop condition | Kernel factor | What it means | Calculator effect |
|---|---|---|---|
| Excellent grain fill | 75,000 to 80,000 | Large, heavy kernels with good test weight. | Raises estimated bushels per acre. |
| Average field corn | 85,000 to 90,000 | Normal kernel size for many scouting estimates. | Balanced pre-harvest estimate. |
| Heat or drought stress | 95,000 to 100,000 | Small kernels, shallow fill, or low test weight risk. | Lowers estimated bushels per acre. |
| Unknown late season | 90,000 to 95,000 | Use when kernels are not fully dented or weight is uncertain. | Builds in a conservative check. |
Common corn yield ranges
| Field situation | Typical yield range | Primary driver | Calculator note |
|---|---|---|---|
| Dryland stress | 90 to 150 bu/ac | Rain timing, stand loss, kernel depth | Use field loss and higher kernel factor. |
| Average grain field | 160 to 220 bu/ac | Hybrid fit, fertility, population | Tickets usually give the strongest final number. |
| Irrigated strong field | 220 to 300 bu/ac | Water, nitrogen, disease control | Check monitor calibration against scale weights. |
| Research or contest strip | 280+ bu/ac | Uniform stand, edge, intensive management | Measure harvested strip acres carefully. |
Row length for 1/1000 acre counts
| Row spacing | Length for 1/1000 acre | Plants counted x 1000 | Best use |
|---|---|---|---|
| 15 inches | 34 ft 10 in | Plants per acre | Narrow-row corn stand checks. |
| 20 inches | 26 ft 2 in | Plants per acre | High population systems. |
| 30 inches | 17 ft 5 in | Plants per acre | Common ear-count scouting strip. |
| 36 inches | 14 ft 6 in | Plants per acre | Wide-row or older equipment spacing. |
Separate harvested yield from biological yield. Ticket bushels divided by harvested acres show what went into storage, while the field-loss setting estimates what the crop may have produced before header, shatter, dropped-ear, or machine loss.
Use several scouting zones. Ear counts are sensitive to thin spots, end rows, compaction lanes, and hybrid changes. Average representative zones before using the kernel method for marketing or storage decisions.
For hours, you might sit in the cab of combine harvester, watching it carve its way across field. But as long as grain doesn’t hit the scale, you’re not sure just what is going on. When it does, the numbers are no longer hypothetical, they become a part of your bottom line.
A few more bushels of corn per acre mean the difference between a good year and one that leaves you scratching your head over the ledger. The calculator above will do the math for you, but knowing why inputs makes a difference makes those numbers more than just data; they’re the path to making your farm pay off.
How to Count Your Corn Yield
By far the biggest error farmers make is confusing their acres planted with acres harvested. For example, suppose you plant eighty acres but left five unharvested, perhaps due to wet conditions on headlands. Using wrong denominator will give you an artificially high yield-per-harvested-acre number. Only count the ground that produce grain and put it in bin.
Sounds easy, right? But people often overlook flooded section or a waterway. You want to keep your yield estimate honest, so the tool allow you to adjust for harvested share. And that honesty comes into play if you’re trying to compare how different field performed compared to each other from one year to next.
On the other hand, intuition often fails when it come to moisture correction. Yes, wet grain is heavier, but that doesn’t mean it has more actual corn in it! For instance, a bushel of corn are defined as weighing a certain amount when its moisture content equals 15.5 percent. If you harvest your crop at 22 percent moisture, all that additional weight is water (not product).
That means that if you didn’t adjust for moisture, you’d end up paying to ship water to the elevator. The table below show what the moisture adjustment looks like. It shows how much it shrinks as moisture increases. You make the correction because you don’t want to pay to haul around water when selling grain or storing it.
This seems like a small thing, but it matter a lot for both sales contract planning and storage. If you don’t do the adjustment, you’ll think you’ve harvested more then you really have.
Counting Ears: Walking the field before combine and estimating yield has nothing to do with predicting weather. It’s based off counting ears (harvestable) per plant, plants per acre, and kernel counts. That’s the part that sounds complicated. A lot of it is knowing what you’re measuring.
The thing to know about the yield-estimating process is that you need to count harvestable ears and pick a realistic kernel size factor, because using a standard factor for a drought-stressed field could of make your estimate too high. Then there is the matter of the “kernel size factor.” Kernels is smaller in a drought year. There are fewer kernels per bushel. That makes a big difference. If you use an average number for a drought year, you’ll guess wrong. Tweak that factor in calculator using ear appearance. It is not exact, but it beats a guess.
Field loss is the silent thief of yield. Ears drop off the header. There’s kickback. There’s shrink in handling. Entering a field loss percentage allows you to back-calculate the biological yield that never saw the machine. This helps you distinguish between mechanical efficiency and agronomic performance.
In other words, did you have a good crop (calculated high biological) or was there something wrong with combine (low ticket yield)? Or was it the other way around? Were both bad? Then you look toward weather or maybe lack of fertility. The key to avoid blaming the crop when it’s really the combine is learning to distinguish those two causes for a poor harvest.
It’s all about yield, which means it’s always going to be a story of weather, soil and your management. The plot comes from the numbers; the meaning comes from context. Whatever measuring tool you use, the intention is the same. You might use pre-harvest scouting data, numbers from the wagon scale, or harvest tickets. I want to know what I’ve got so I can confidently make my next move. Uncertanty becomes a plan when you have accuratley numbers.