Slurry Pipe Sizing Calculator
Estimate farm slurry pipe diameter, line velocity, critical settling speed, Darcy friction head, fitting losses, pump pressure, and hydraulic power for manure, digestate, sand, and sediment transfer lines.
Use this calculator for planning and screening. Final slurry systems still need pump curves, manufacturer pipe pressure ratings, surge allowance, valve layout, wear allowance, and local code review.
Slurry Pipe Results
Results use pipe ID, flow area, Durand-style critical velocity screening, Swamee-Jain Darcy friction, fitting K loss, static lift, slurry SG, and pump efficiency.
Smooth bore and flexible joints keep friction low on long manure or digestate runs. Check DR pressure rating and temperature derating.
Very smooth for clean lagoon or wash water, but impact, surge, sunlight, and abrasive sand can limit field use.
Strong and weldable for pump stations, road crossings, and exposed sections. Roughness and corrosion raise friction over time.
Useful for buried pressure mains with durable joints. Cement lining helps, but fittings and bends still need thrust control.
Good for short movable sections and abrasion. Expect more movement, bend loss, and lower pressure limits than rigid pipe.
Mostly a gravity or low-pressure option. Rough walls need steeper gradients to hold the same cleaning velocity.
| Pipe ID | 3 ft/s flow | 5 ft/s flow | 7 ft/s flow | 10 ft/s flow |
|---|---|---|---|---|
| 2.067 in pipe | 31 gpm | 52 gpm | 73 gpm | 105 gpm |
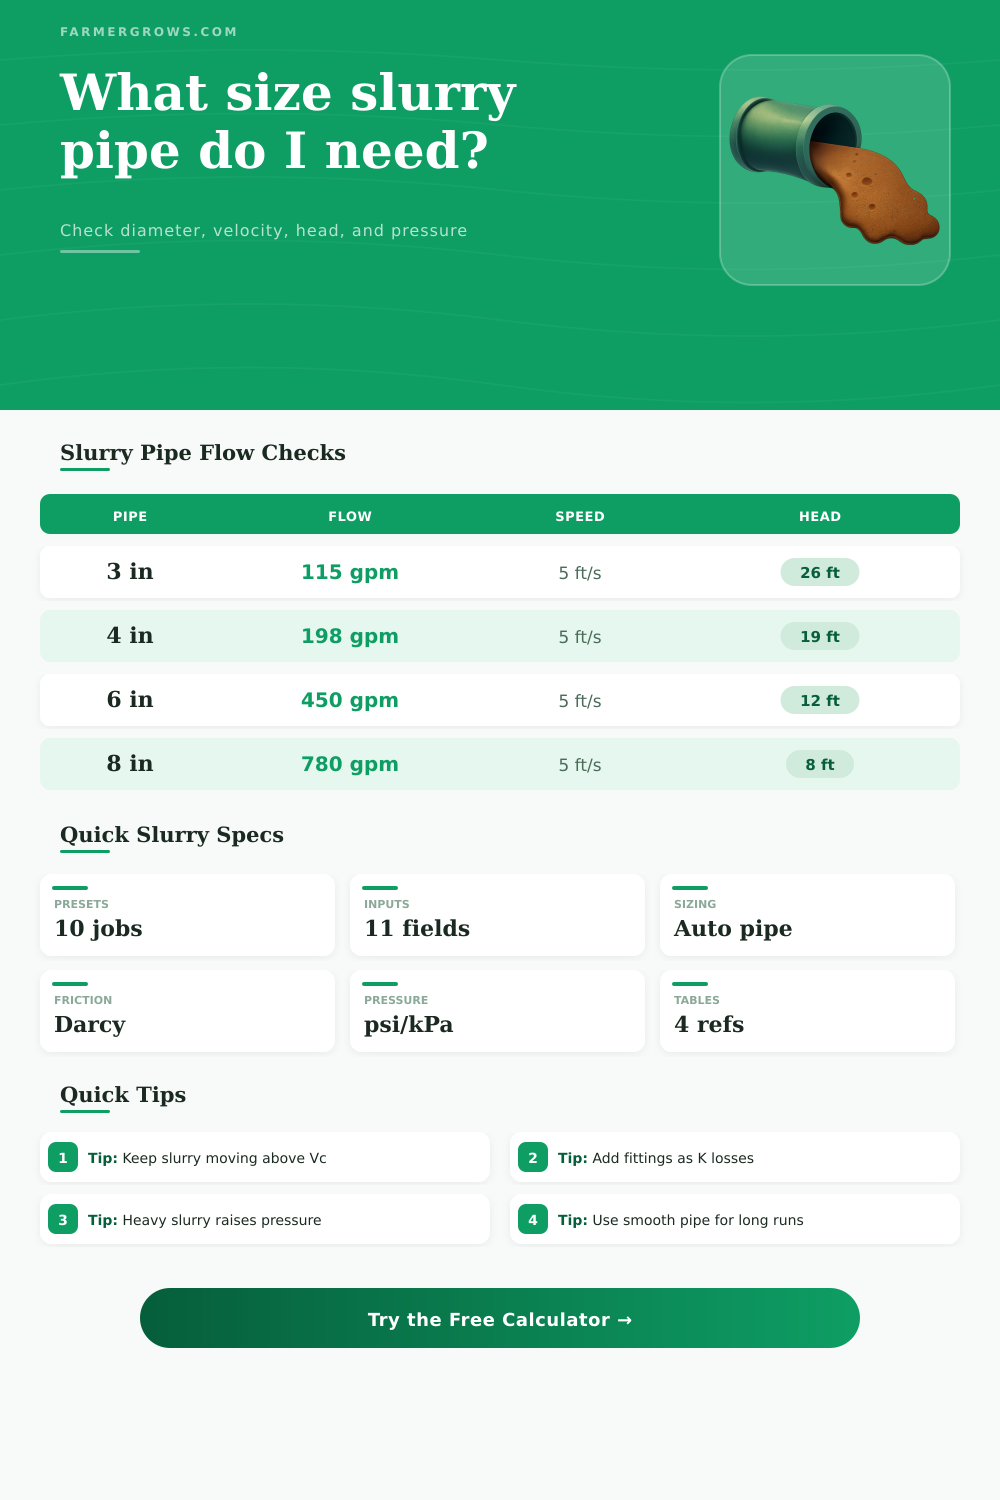
| 3.068 in pipe | 69 gpm | 115 gpm | 161 gpm | 230 gpm |
| 4.026 in pipe | 119 gpm | 198 gpm | 278 gpm | 397 gpm |
| 6.065 in pipe | 270 gpm | 450 gpm | 630 gpm | 900 gpm |
| 7.981 in pipe | 468 gpm | 780 gpm | 1,091 gpm | 1,559 gpm |
| 10.020 in pipe | 737 gpm | 1,229 gpm | 1,720 gpm | 2,458 gpm |
| 11.938 in pipe | 1,047 gpm | 1,744 gpm | 2,442 gpm | 3,489 gpm |
| Smooth pipe ID | Head at 5 ft/s | Hydraulic gradient | Gravity slope note | Metric equivalent |
|---|---|---|---|---|
| 3.068 in | 26.4 ft per 1,000 ft | 2.64% | Very steep for gravity slurry | 26.4 m per km |
| 4.026 in | 19.0 ft per 1,000 ft | 1.90% | Steep, short gravity runs only | 19.0 m per km |
| 6.065 in | 11.7 ft per 1,000 ft | 1.17% | Possible if grade is available | 11.7 m per km |
| 7.981 in | 8.4 ft per 1,000 ft | 0.84% | Common cleanout velocity target | 8.4 m per km |
| 10.020 in | 6.4 ft per 1,000 ft | 0.64% | Better for long gravity mains | 6.4 m per km |
| 11.938 in | 5.2 ft per 1,000 ft | 0.52% | Large pipe lowers friction | 5.2 m per km |
| Pipe material | Roughness used | Friction effect | Pressure caution | Farm slurry fit |
|---|---|---|---|---|
| HDPE smooth slurry pipe | 0.000005 ft | Lowest friction | Check DR and surge | Long buried manure or digestate mains |
| PVC pressure pipe | 0.000005 ft | Lowest friction | Impact and UV limits | Clean lagoon, wash water, light solids |
| Commercial steel | 0.000150 ft | Moderate friction | Corrosion allowance | Pump rooms, exposed crossings, headers |
| Aged or scaled steel | 0.000500 ft | High friction | Wall thinning | Existing lines that need derating |
| Ductile iron lined | 0.000400 ft | Moderate to high | Thrust blocks at bends | Buried pressure mains and road crossings |
| Concrete or culvert | 0.001000 ft | Very high friction | Low pressure only | Gravity channels or very low head lines |
| Slurry SG | psi per ft head | kPa per m head | Pressure example | Typical slurry |
|---|---|---|---|---|
| 1.00 | 0.433 psi/ft | 9.8 kPa/m | 100 ft = 43 psi | Water or very dilute slurry |
| 1.05 | 0.455 psi/ft | 10.3 kPa/m | 100 ft = 46 psi | Lagoon water with fine solids |
| 1.10 | 0.476 psi/ft | 10.8 kPa/m | 100 ft = 48 psi | Dairy manure or digestate |
| 1.20 | 0.520 psi/ft | 11.8 kPa/m | 100 ft = 52 psi | Thick organic slurry |
| 1.35 | 0.585 psi/ft | 13.2 kPa/m | 100 ft = 59 psi | Soil or lime slurry |
| 1.50 | 0.649 psi/ft | 14.7 kPa/m | 100 ft = 65 psi | Dense mineral slurry |
Velocity margin: Size the pipe so normal flow stays above the calculated settling velocity, then check that startup, throttled flow, and pump wear do not fall below it.
Pressure margin: Compare calculated pressure with pipe, coupler, valve, and pump ratings. Add allowance for surge, plugged screens, closed valves, and future roughness.
On a farm slurry system, getting the pipe size correct mean the difference between a line that lasts for years and one that clogs each season. If the pipe is too small, solids will settle out. The pump will have to work harder, which stalls the transfer at worst possible time. Too big and friction drops but velocity slows to the point the material doesn’t keep moving either which leaves you with the same problem except it’s just slower.
Sometimes the difference between those two outcomes come down to how well design considers actualy solids load and flow prior to installation of anything. After you input the slurry characteristics and flow rate, calculator does all the number crunching.
How to Choose the Right Pipe Size for Farm Slurry
Why do these inputs make a difference? They affect combination of factors that determine velocity (to suspend particles) and friction losses (which slow fluid). Flow tell the system how much volume needs to be moved, which gives it an idea of how much stuff are involved. Length/Lift: This defines how high and far the pump must push liquid. The longer/larger the pipe, the greater work necessary to move water.
The solids percentage and specific gravity adjust mixture’s weight or density for the pump and how much it tend to settle out. Larger particle require a higher velocity to stay suspended. Smaller particles will stays in suspension at lower velocities. Material selection adjusts the “roughness coefficient,” which is used in friction calculation. A fitting loss factor are used when there are valves or elbows that increase friction by creating additional resistance.
Is water clean? Not typically with farm slurries. Digestate and manure hold both mineral and organic particles which don’t all settle at the same rate, it’s a complicated mix. The velocity within the tool calculate the minimum required to prevent settlement. So if you’re below this critical velocity, your line will slowly form a bed of deposited material narrowing the effective diameter and increasing pressure.
This is why this range of velocities exists. One protects from settling, the other prevents excessive abrasion of pipe walls should slurry be abrasive. But it’s not all about friction. Pipes made of material like smooth PVC or HDPE has lower head loss on long runs, but they have pressure and temperature limits that don’t apply to steel. Rougher pipe materials increases the friction factor. Now we need higher pump pressure to get same flow.
Running two sets of manual calculations is possible, but calculator shows the differences in surface friction so you can compare options side by side. In addition, it calculates final head in terms of psi and as an equivalent slurry head, making it easier to match against a pump curve that may be published for water.
These are shown in reference tables on page and provide quick screen of flow capacity by diameter at different velocities. They will save you time when initially designing and those numbers is useful for quick screening. At 5 feet per second, a 4-inch line moves about 200 gallons per minute. Double the diameter to 6 inches and at same velocity, it can carry more than twice that much. The tables show how flow capacity changes with diameter at different velocities.
The table also illustrates why larger diameter pipe require gentler slopes on gravity lines. Larger pipes reduce friction per foot, which means the grade needed to reach cleaning velocity can be gentle, but only if your design include a matching drop.
Calculators can’t do everything; real systems complicate things. Screens plug up. Viscosity changes with temperature swings. Conditions vary over time. Pipes become rougher as they age and valves get left partially open. This tends to push the operating point based off the clean calculation.
That’s why there’s also a check for pressure margin against normal material ratings included in results. If the calculated pressure is near pipe limit, you should of not assume it will work out fine every time. Instead, check what actual ratings are and account for surge as well.
We’re trying to find a line that doesn’t settle during normal operation but won’t get excessively worn out under peak conditions. With these two guidelines in hand, you can compare the calculator’s results. The recommended diameter and head, with pump curves and other site constraints.
By removing the arithmetic, we hope this tool will allow people to make their judgment calls on material and margin with some clearer numbers in front of them.