🐄 Beef Carcass Yield Calculator
Estimate live-to-carcass yield, USDA-style yield grade, chilled and aged carcass weight, bone and trim loss, and retail cut pounds for freezer beef or plant planning.
Pick a realistic carcass starting point, then adjust live weight, dressing percent, fat thickness, ribeye area, KPH fat, bone and trim, cooler shrink, aging loss, and cutting style.
Beef Carcass Yield Results
Live weight, dressing percentage, yield grade factors, aging loss, and retail cuts are calculated together.
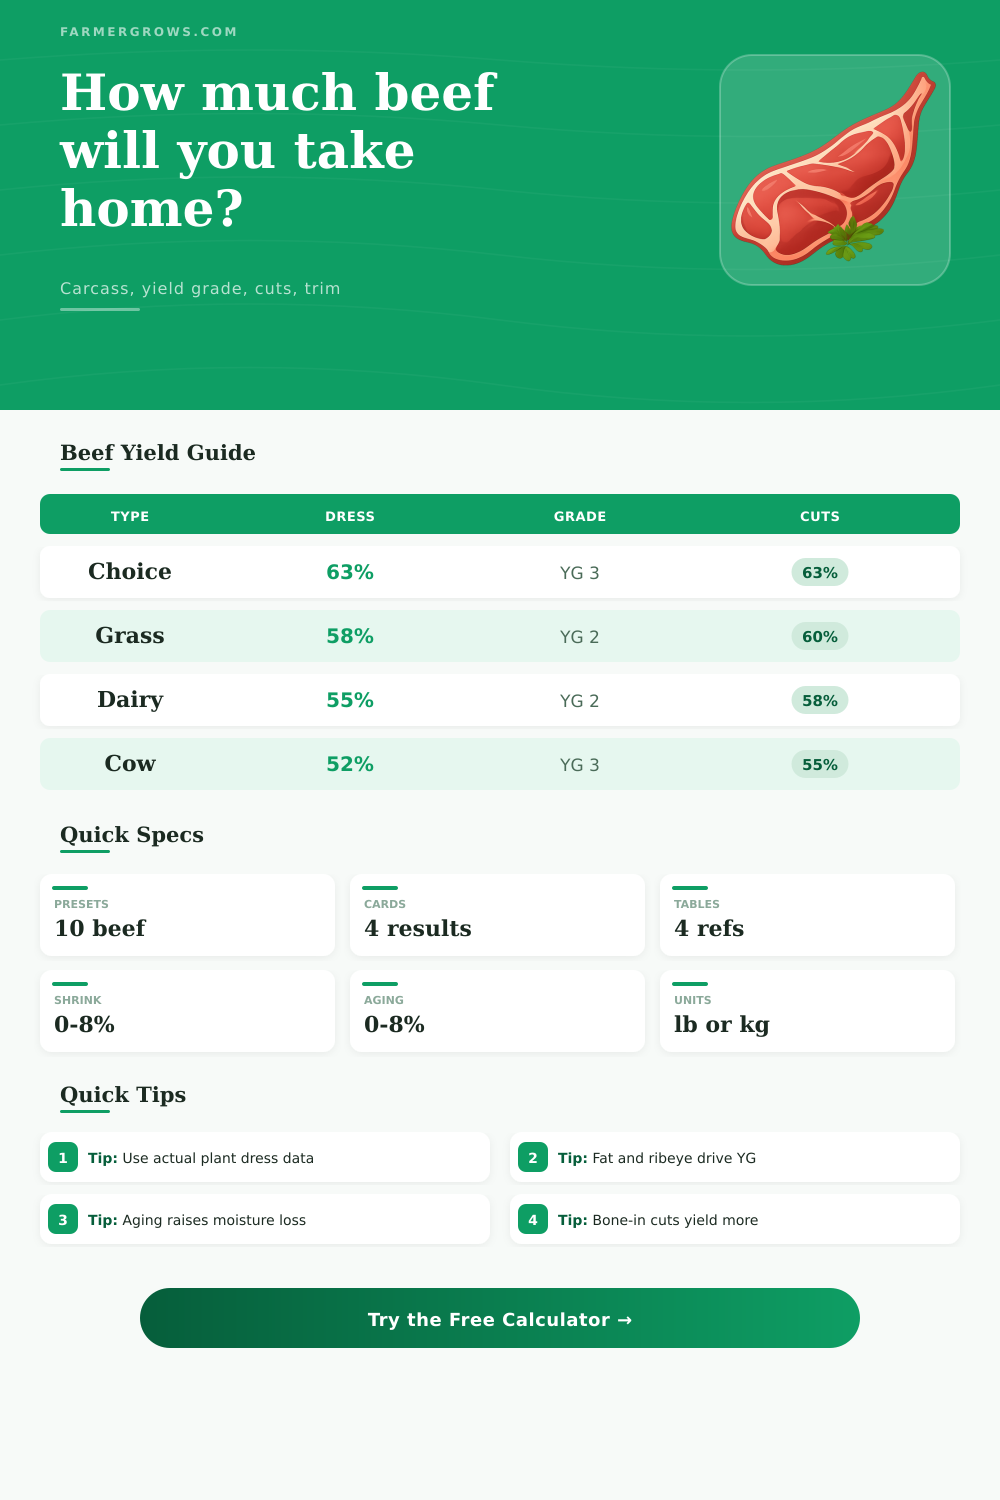
| Beef type | Typical dressing percent | Common retail result | Planning note |
|---|---|---|---|
| Finished grain steer | 62 to 64 percent | Moderate to high retail weight | Clean hide, good finish, and muscling usually lift hot carcass weight. |
| Finished heifer | 60 to 63 percent | High retail weight | Often similar to steers but sometimes slightly lighter muscling. |
| Grass finished beef | 56 to 60 percent | Moderate retail weight | Lower finish and more variability make actual plant data useful. |
| Dairy or dairy cross beef | 54 to 58 percent | Moderate retail weight | Frame, muscling, gut fill, and breed type can swing results. |
| Cull cow | 49 to 54 percent | Lower retail weight | More gut fill, age, and trim can reduce both dress and cutout. |
| Mature bull | 55 to 60 percent | Variable retail weight | Muscle helps, but age, fat, and cutting style change saleable packages. |
| Factor | Calculator input | Formula effect | Field interpretation |
|---|---|---|---|
| Adjusted fat thickness | External fat over ribeye | Raises yield grade strongly | More backfat usually means more trim and lower cutability. |
| KPH fat | Kidney, pelvic, heart fat percent | Raises yield grade modestly | Internal fat adds waste but is less dominant than external fat. |
| Hot carcass weight | Calculated from live weight and dress | Raises yield grade slightly | Heavier carcasses need enough ribeye area to stay efficient. |
| Ribeye area | Square inches at rib | Lowers yield grade | More muscling improves cutability for a given carcass weight. |
| Yield grade score | Computed grade from formula | Lower is leaner cutability | YG 1 is very lean, YG 3 is common, YG 5 is overfat. |
| Loss point | Typical range | Calculator field | Why it matters |
|---|---|---|---|
| Live shrink | 0 to 5 percent | Live shrink | Holding and hauling change shrunk live weight before dressing. |
| Cooler shrink | 0.5 to 2.5 percent | Cooler shrink | Hot carcass weight loses moisture during chilling. |
| Dry aging loss | 1 to 8 percent | Aging loss | Longer hang time and dry air reduce carcass weight before cutting. |
| Bone and trim | 18 to 38 percent | Bone and trim loss | Bone-in orders keep more weight than boneless or close-trim specs. |
| Retail cut style | Cut sheet dependent | Cutting style | Steaks, roasts, grind, and short ribs shift the final package mix. |
| Cutting style | Steaks | Roasts | Ground, stew, and other cuts |
|---|---|---|---|
| Balanced freezer beef | About 28 percent | About 23 percent | Ground and stew 34 percent, other cuts 15 percent. |
| Steak heavy | About 32 percent | About 19 percent | Ground and stew 34 percent, other cuts 15 percent. |
| Roast heavy | About 22 percent | About 27 percent | Ground and stew 36 percent, other cuts 15 percent. |
| Boneless heavy | About 25 percent | About 22 percent | Ground and stew 42 percent, other cuts 11 percent. |
| Lean grind program | About 14 percent | About 22 percent | Ground and stew 50 percent, other cuts 14 percent. |
Compare live, shrunk live, hot carcass, chilled carcass, and packaged retail weight separately. Mixing those bases is the fastest way to overstate take-home beef.
Dressing percentage, cooler shrink, aging loss, and trim vary by animal, facility, cut sheet, and hanging time. Replace default assumptions with actual harvest records whenever possible.
This calculator is for planning and customer communication only. Final weights depend on actual live weight, hide condition, gut fill, carcass trim, inspector disposition, cooler conditions, cutting specs, and plant records.
A carcasses yield estimate is a tool that will allow you to calculate how much meat will be produced from an animal. You cannot rely on the live weight of an animal to determine how much meat the animal will produce. You cannot also rely on the hanging weight of the animal to determine how much meat the animal will produce.
However, by using a carcass yield estimate, you can track the weight of the animal as it lose weight during the slaughter process. Using this estimation process, butchers will be able to plan for the amount of meat that is going to be available for consumption. The first loss of weight that occurs is known as live shrink.
How to Estimate Meat Yield from an Animal
The live shrink of an animal occur before the animal reaches the processing plant. During this stage, the animal may lose weight while in the trailer or pen. This weight is permanent and must be accounted for when calculating how much meat the animal will produce.
Following live shrink, the processor will calculate the dressing percentage of the animal. The dressing percentage will vary depending on the animal. Depending on the type of steers, such as a finished steer versus a lean dairy cross, the dressing percentages will differ.
The second measurement of weight is the yield grade. The yield grade determine the amount of meat that will come from the carcass after slaughter. To calculate the yield grade, you must measure the thickness of the external fat, the kidney and pelvic fat, the hot carcass weight, and the ribeye area.
Higher scores on the yield grade do not indicate the quality of the beef. However, higher scores indicate that the butcher will trim more of the carcass instead of becoming roasts or steaks. Next, the weight of the carcass will be lost after it is chilled.
During the chilling and aging process for the carcass, the carcass will lose more weight. Cooler shrink will occur when the meat reach the same temperature as the air in the cooler. Aging loss will happen if the carcass was hanging for a longer period of time in the processing plant.
Even though the percentage of weight that is lost during cooler shrink and aging loss is small, the total weight of all the carcasses that is processed will show the total weight of the beef that is lost during this process. Following the aging process, the cutting style will determine the division of the carcass. For a balanced cutting style, the butcher divides the weight equally between different types of steaks, roasts, and ground beef.
For a steak-heavy cutting style, more weight is put into individual steaks and less weight is available for ground beef. For a lean-grind cutting style, more weight is put into ground beef and less weight is available for the production of steaks. Additionally, bone-in cuts will have more weight then boneless cuts.
Close-trimmed steaks will contain more weight than standard trimmed steaks. People make various mistakes when using this tool. One of the most common mistakes is incorrectly comparing different weight bases.
The live weight of the animal can be compared with the hanging weight, or you can compare the hanging weight with the packaged meat weight. However, this is a mistake because each stage of the process remove a different weight of the animal. Comparing these different weights will create an inflated expectation of the amount of meat that will be produced.
To avoid this mistake, you should of kept the stages of the process separate from one another. Additionally, people must understand the weight of the beef that is removed at each stage of the process. Another factor that will impact the final numbers of the carcass is the various factors that is within the processing plant.
The condition of the hide, the gut fill at the time of harvest, the inspection of the carcass, and the humidity within the cooler will impact the final weight of the beef that is produced. To account for these factors, a carcass yield estimate will be used to establish a baseline of the weight of the beef. The baseline will then be updated with the actual numbers from the processing plant.
Within the processing plant, there are reference tables of the dressing percentages and the yield grade that will be used. These reference tables will allow the butchers to determine if the numbers of the beef that they produced are within the normal range of weights of the beef. By understanding the weight that is lost at each stage of the process, butchers will be able to remember and understand the total weight of the beef that will produce.