Nitrogen Footprint Calculator
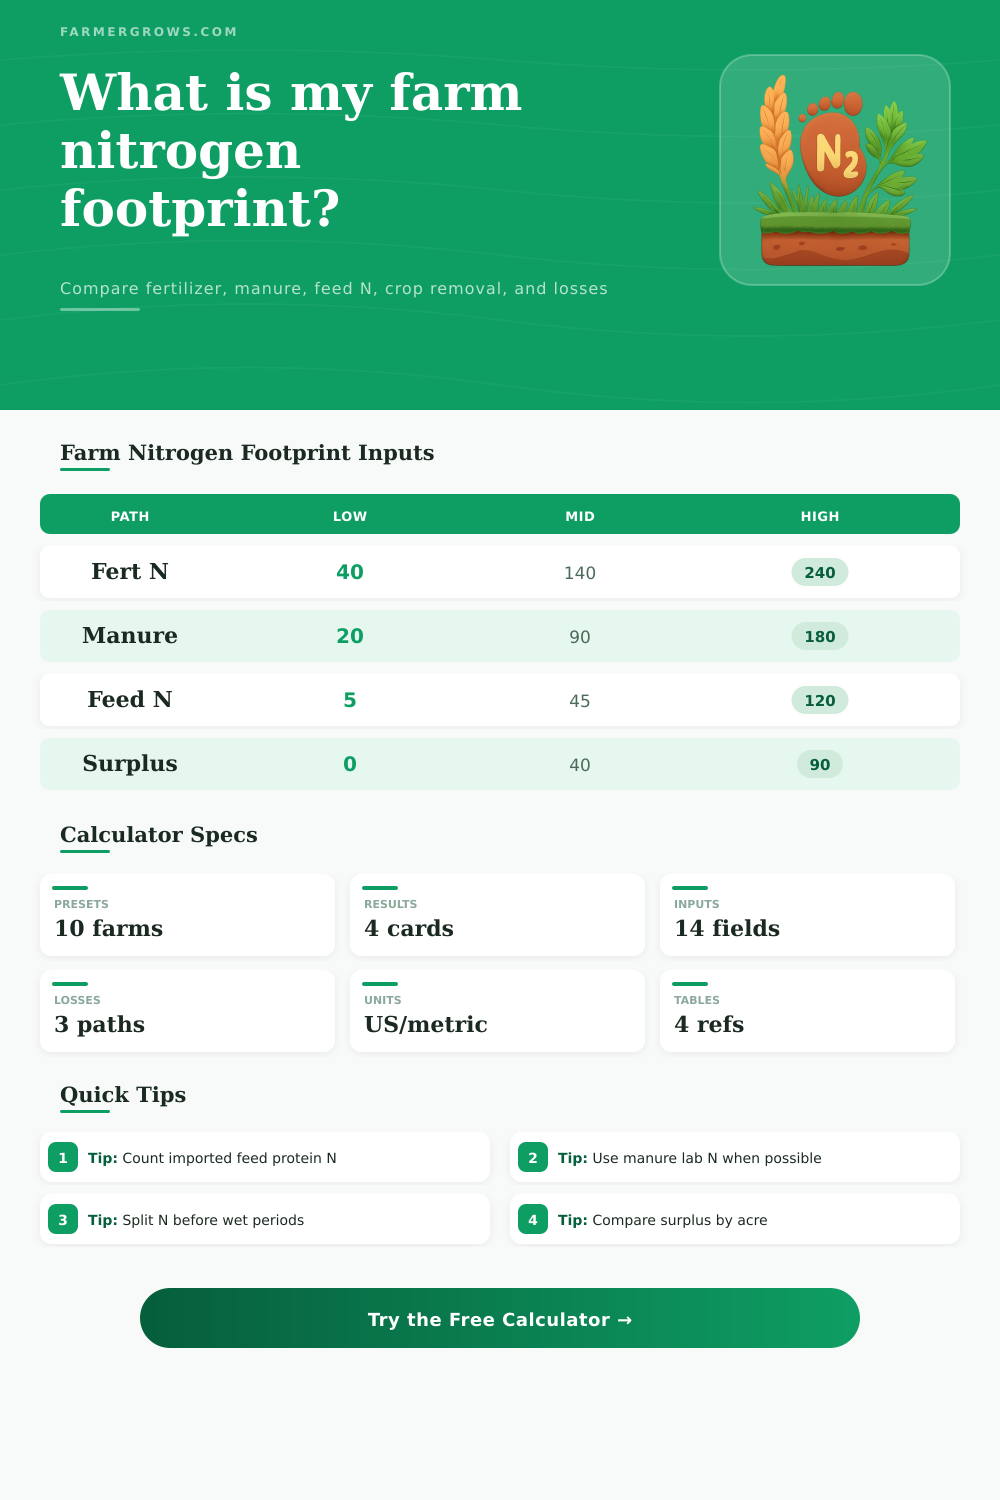
Estimate farm nitrogen footprint from fertilizer N, manure N, imported feed protein N, other imported N, crop removal, loss pathway risk, acres, yield, surplus per acre, use efficiency, and mitigation options.
Use this calculator as a screening worksheet for whole-farm or field-block planning. Enter annual rates and imported feed amounts, then compare nitrogen inputs with crop N removal and estimated loss pressure.
Nitrogen Footprint Results
The footprint will appear after calculation.
| N source | Calculator entry | Conversion used | Footprint note |
|---|---|---|---|
| Fertilizer N | lb N/ac or kg N/ha | Entered as plant nutrient N | Counts as imported N unless produced on farm. |
| Manure N | Total N rate and available % | Total N counts in footprint; available N feeds crop | Use a manure test when possible. |
| Imported feed protein | Feed weight, dry matter, crude protein | Dry feed x CP / 6.25 | Purchased protein can become manure N. |
| Other imported N | Total annual N | Total divided by acres | Use for compost, bedding, or irrigation nitrate. |
| Crop removal | Yield x N removal factor | Harvested N exported from farm or field | Higher removal improves use efficiency. |
| Crop or output | US factor | Metric factor | Common caution |
|---|---|---|---|
| Corn grain | 0.67 lb N/bu | 12 kg N/t grain | Stover left in field keeps some N cycling. |
| Corn silage | 8 lb N/ton | 8 kg N/t silage | Whole-plant harvest exports more N. |
| Soybean grain | 3.8 lb N/bu | 65 kg N/t grain | Fixation supplies N but grain exports protein. |
| Winter wheat | 1.25 lb N/bu | 22 kg N/t grain | Protein goals can raise crop N demand. |
| Alfalfa hay | 50 lb N/ton | 50 kg N/t hay | High removal, often supplied by fixation. |
| Mixed vegetables | 5.5 lb N/ton | 5.5 kg N/t crop | Residue and cull handling change export. |
| Pathway | Low risk | Medium risk | High risk | Typical driver |
|---|---|---|---|---|
| Volatilization | 3% | 8% | 16% | Surface urea, warm weather, residue, high pH. |
| Leaching | 5% | 12% | 22% | Nitrate, sandy soil, tile drainage, heavy rain. |
| Denitrification | 3% | 8% | 16% | Saturated soil, compaction, warm wet periods. |
| Feed N pressure | 10% | 20% | 35% | Imported protein recycled through manure storage. |
| Indicator | Low concern | Watch zone | High concern | First review |
|---|---|---|---|---|
| Surplus N | 0 to 25 lb/ac | 26 to 60 lb/ac | Over 60 lb/ac | Yield goal, credits, and imported feed. |
| N use efficiency | Over 70% | 50% to 70% | Under 50% | Timing, manure credit, crop removal. |
| Loss-risk N | Under 20 lb/ac | 20 to 45 lb/ac | Over 45 lb/ac | Placement, split timing, wet fields. |
| Feed N share | Under 15% | 15% to 35% | Over 35% | Ration protein and manure export. |
Tip: Count purchased feed protein as an imported nitrogen source on livestock farms. Even if feed N later appears as manure, it first crossed the farm boundary.
Caution: A low surplus does not prove low loss. Poor timing, surface urea, saturated soils, and sandy fields can still push N into loss pathways.
Nitrogen moves through the farm in a variety of ways. Because nitrogen is able to enter the farm in a variety of ways, it can be difficult to track where the nitrogen on the farm is coming from. Nitrogen can come to the farm from fertilizers, manure, and even feed protein that is imported for an farm.
Nitrogen that comes into the farm as fertilizers, manure, and feed protein has a variety of movement paths within the farm, but there is still an interest in knowing how much of that nitrogen becomes the crop that grow on the farm, and how much of that nitrogen becomes a surplus of nitrogen on the farm. The surplus of nitrogen on the farm is the amount of nitrogen that is left within the soil after the crops have harvested the nitrogen that they needed to produce their crops. The nitrogen footprint attempt to measure the total amount of that surplus of nitrogen that is present on the farm.
Nitrogen on the Farm: Where It Comes From and Where It Goes
Farmers can track the amount of fertilizer and manure that is introduced to the farm, as those are costs to the farmers. However, feed protein is not easily tracked, because the feed protein is an indirect source of nitrogen for the farm. The nitrogen in the feed protein becomes the livestock that eat the soybean meal or the distillers grains.
The calculator help to convert the tonnage of feed, the dry matter of that feed, and the amount of crude protein to a measurement of nitrogen. This nitrogen will eventually leave the farm with the manure of the livestock. To calculate the surplus of nitrogen on the farm, the nitrogen inputs to the farm are measured, and the amount of nitrogen that the crops remove is subtracted from that initial measurement.
The result of this calculation indicates whether there is a surplus of nitrogen on the farm, whether that system is in balance, or if it has an excess of nitrogen. Surpluses of nitrogen are common on livestock farms. However, this figure does not reveal in what ways the nitrogen leave the farm.
Nitrogen can leave the farm either through volatilization, leaching, or denitrification. The calculator can be used to mark the risks of each of these three processes. The reference tables can reveal how much nitrogen is removed by each type of crop.
For instance, corn grain removes 2/3 of a pound of nitrogen per bushel, and alfalfa hay remove 50 pounds of nitrogen per ton of hay. These figures are based on the nitrogen that was measured from the harvested materials. These factors must be used to calculate how much nitrogen is removed by the crops on the farm; each type of crop removes a different amount of nitrogen from the soil.
If the farmer accounts for the correct amount of nitrogen that is removed by the crops, the efficiency calculations will be accurate. Efficiency is calculated as the portion of the nitrogen that comes to the farm that ends up in a product that is sold by the farm. The calculator has a limit to its capabilities.
For example, it does not consider the timing of nitrogen movement through the farm. A heavy amount of rain will move more nitrogen through the soil than the surplus of nitrogen that is calculated each year. Introducing a cover crop at the proper time of the year can help to lessen nitrogen loss.
These options are included in the calculator, but they use average percentages to represent the reduction in nitrogen loss rather than using data from the weather for each day of the year. The calculator is limited in regard to the area that it can reflect nitrogen movement within the farm. Specifically, the calculator does not account for differences between types of soil.
For instance, different fields within a farm may have different types of soil, ranging from sandy soil to soil that does not drain well. Each of these soils will have different requirements for management of nitrogen compared with other fields on the farm. The loss risk setting can help to indicate these differences within the field.
The primary value of using this calculator is testing the nitrogen footprint of small changes to the farm before implementing those changes. For instance, the nitrogen footprint can be calculated after making small changes to the availability of manure on the farm. Similarly, the footprint can be calculated prior to the implementation of changes in the amount of purchased feed protein that is added to the livestock.
Another change that can be tested is the addition of a cover crop. Each of these changes will have an impact on the nitrogen footprint of the farm. By testing each change, the farmer can determine which change will have the most impact on the nitrogen footprint of the farm with the specific types of crops and livestock that is managed on that farm.
In using the calculator in this suggested way, the calculator becomes a planning tool that allows farmers to make decisions about the management of their farm. While it may seem beneficial to have the nitrogen on the farm have a surplus of nitrogen to the extent that it reaches zero (indicating balance between the amount of nitrogen that comes into the farm and the amount of nitrogen that leaves the farm), it is actualy beneficial to know the location of that surplus of nitrogen, and in what ways it will leave the farm. By knowing both of these elements, farmers can create a plan for the next growing season to reduce the leaks of nitrogen out of their fields.