TILLAGE: Repeated use of an herbicide can train some weed populations to survive, so it’s no longer about the weather cooperating or the spray looking right. It used to be called bad luck when the spray went on and the weeds comes back stronger then the next year in patches. But we know now it wasn’t bad luck. That pattern repeats across farms and is why there are mode of action charts.
Understanding what process in plant each herbicide interrupts is the only fix. There are twelve groups, ordered by what each one targets on the plant (enzyme, structure). For instance once you realize that Group 4 imitates an auxin on broadleaf and Group 1 is targeting fatty acid production in grasses, it’s clear why rotation of or mixing of products make sense.
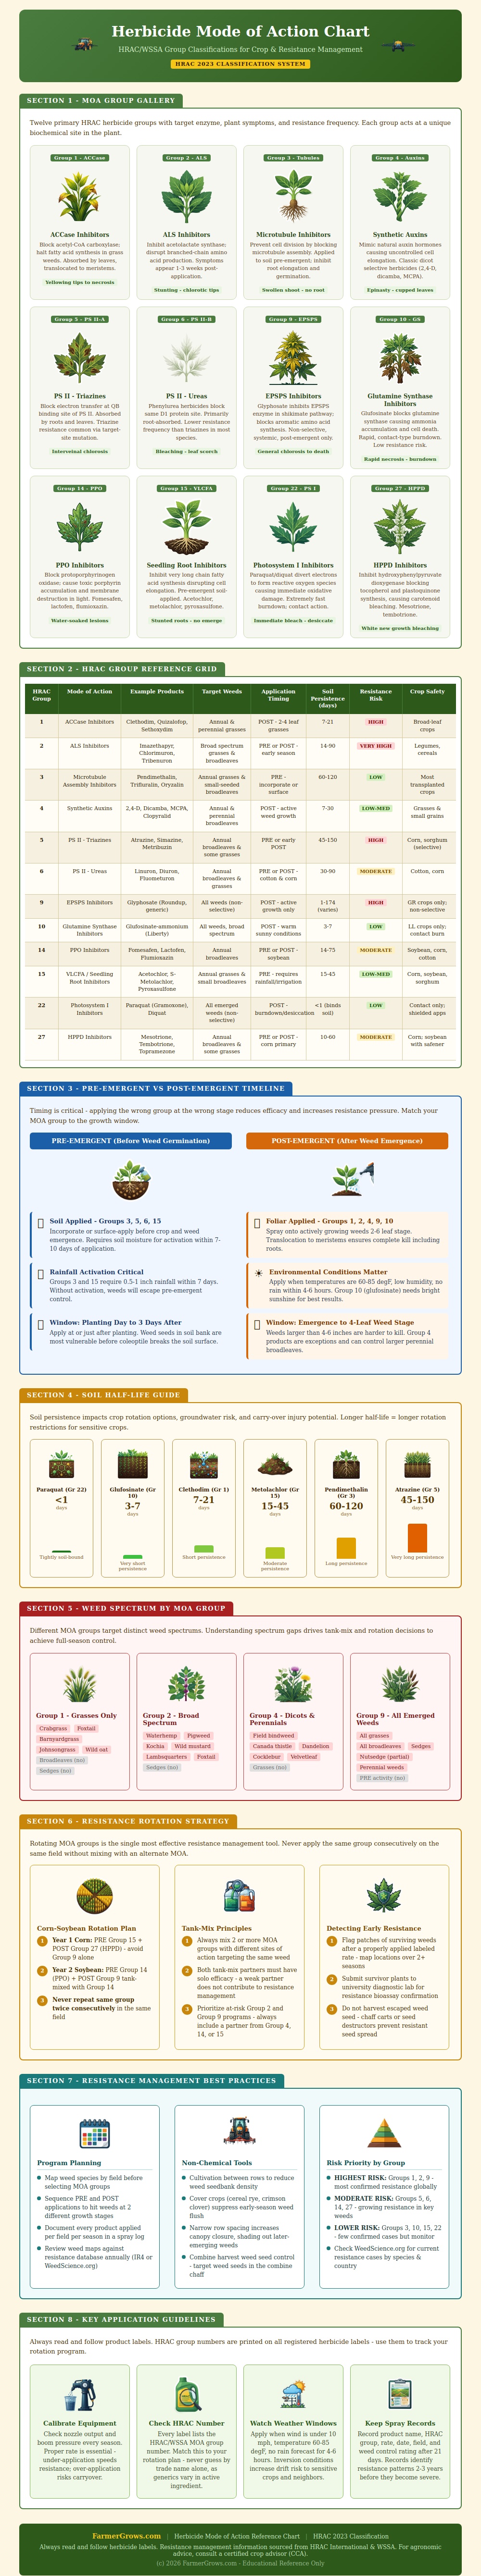
How to Manage Herbicide Resistance
If I repeatedly apply just one product, all I am doing is selecting for the rare few that have already had a mutation at that site to protect against its activity. They survives and produce seed which are now already tolerant to the next generation. Visual layout helps track the pattern easy without having to memorize who has what active ingredient.
Decision-making is made more complex by how long the chemical stays in soil. While some molecules go away in days, others persist in months. When a persistent product is used on a sensitive crop, it may stunt seedlings even though there’s no more weed threat because of its lingering presence in the soil. So again, rotation decisions reflect both potential for soil carryover harm as well as resistance risk.
Contact products that quickly dissipate gets out of your way fast, enabling an instant follow-up spray. Longer-lasting pre-emergents help stop early-season weeds, but must be timed for the next crop accordingly. It’s not just which group you apply, but when.
With pre-emergents, it has to get down in the ground first; that means before the weeds emerge, and there needs to be moisture for activation. With post emergents, smaller size and active growth equals better movement to the growing point, yielding better kill. The chart breaks out the windows, so you apply the right product at the right time, rather than applying what’s on hand regardless. Even with the correct mode of action, if you miss the window, you’re sunk.
The same holds true with tank mixing. Pairing two populations that target distinct sites within the same weed population sharply reduces the odds of having a survivor resistant to both treatments. Because each partner needs to be strong enough to stand alone, it’s a simple requirement. Having a weak partner as an excuse to say “I have diversity” doesn’t slow resistance down.
The chart flags those as having a higher resistance risk worldwide, so they should of the priority when deciding which partners to mix. Chemical options can be paired with non-chemical ones. You can reduce overall weed pressure by following practices like planting in narrow rows, growing cover crops, and managing to harvest weed seed. Doing this slows down how fast resistance traits is shared among weeds exposed to any selective pressure.
These tactics aren’t replaced on the chart. They’re part of an integrated program where the chart explains which chemical options still work. There’s the practical lesson: Plot out which weeds you have, which group you hit them with last year, and pick a new mode of action for this year’s plan. See where the persistence column matches up in the crop rotation you’re planning.
Note which herbicide you sprayed and how effective it was. After a couple or even three years, the picture emerges. Those once-inevitable patches begins to shrink.