Soil Test Calculator
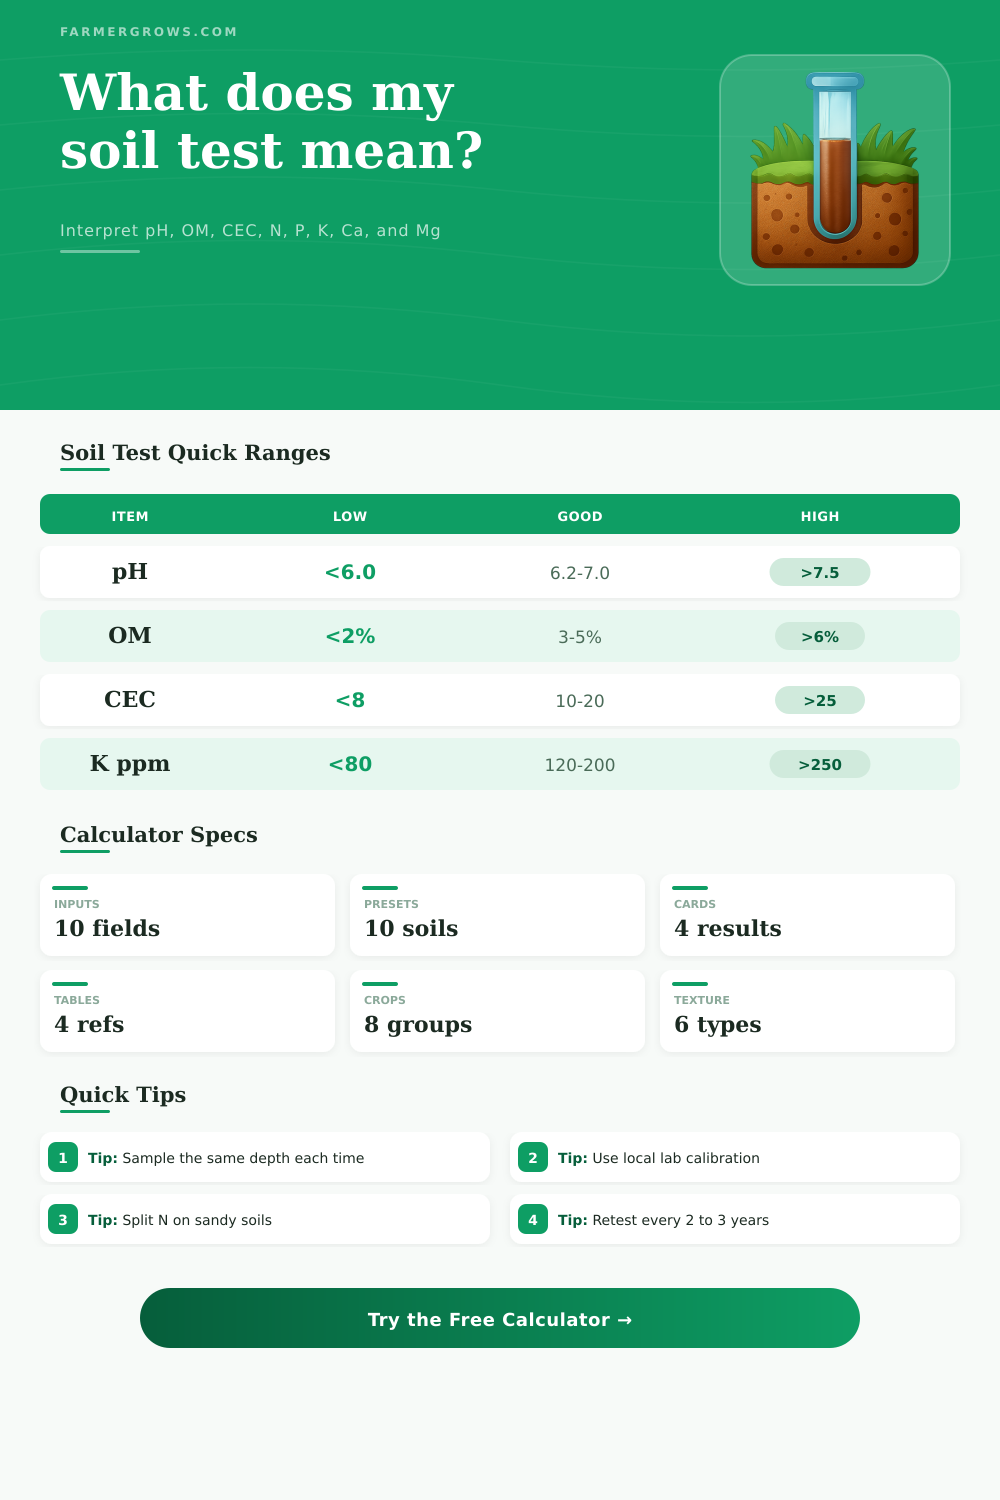
Interpret soil pH, organic matter, CEC, nitrate nitrogen, phosphorus, potassium, calcium, and magnesium against crop group, yield goal, and texture.
Use ppm values from a recent lab report. This calculator gives planning-grade interpretation using common sufficiency bands; final fertilizer rates should follow local extension calibration, crop removal, manure credits, and the lab method used.
Soil test interpretation
Review pH, nutrient sufficiency, cation balance, and sampling guidance together before applying amendments.
| Crop group | Target pH | Low pH interpretation | High pH interpretation |
|---|---|---|---|
| Corn, soybean, small grain | 6.2 to 7.0 | Below 6.0 may reduce nutrient availability and nodulation | Above 7.5 can tie up phosphorus and micronutrients |
| Alfalfa and high-demand hay | 6.8 to 7.2 | Below 6.5 limits persistence and nitrogen fixation | Above 7.6 may increase iron and zinc deficiency risk |
| Vegetables and pasture | 6.2 to 6.8 | Below 6.0 often calls for lime planning | Above 7.4 favors alkaline-tolerant crops and banded P |
| Blueberry and acid small fruit | 4.8 to 5.5 | Below 4.5 can injure roots and reduce calcium uptake | Above 5.8 is too alkaline for many acid fruit systems |
| Nutrient | Low | Medium / optimum | High / drawdown |
|---|---|---|---|
| Nitrate-N | Less than 15 ppm: sidedress or starter need likely | 15 to 30 ppm: moderate available N credit | More than 30 ppm: account for soil N before adding more |
| Phosphorus P | Less than 15 ppm: build-up priority | 15 to 40 ppm: maintenance or banding zone | More than 40 ppm: drawdown or starter-only approach |
| Potassium K | Less than 100 ppm: high response risk | 100 to 200 ppm: maintenance range | More than 200 ppm: drawdown unless crop demand is heavy |
| Calcium / magnesium | Low Ca below 500 ppm or Mg below 60 ppm | Ca:Mg ratio 3:1 to 8:1 is a practical flag range | Very high Mg or Ca may point to structure or pH issues |
| Measure | Low reserve | Moderate reserve | High reserve |
|---|---|---|---|
| CEC | Less than 8: sandy, leaching-prone, split applications | 8 to 18: typical loam buffering | More than 18: strong nutrient holding, slower pH change |
| Organic matter | Less than 2%: low biological reserve | 2% to 5%: practical mineral soil range | More than 5%: strong nutrient cycling and water holding |
| Sandy texture | Lower CEC, faster nitrate and potassium movement | Use smaller, timed nutrient doses | Watch irrigation and leaching risk |
| Clay texture | Higher CEC, stronger buffering | K can be held or fixed by clay minerals | Lime and gypsum reactions move more slowly |
| Use | Common depth | Best timing | Calculator note |
|---|---|---|---|
| Routine pH, P, K, OM, CEC | 0 to 6 or 0 to 8 in | Same season every cycle | Keep depth consistent so trends are real |
| Nitrate-N for annual crops | 0 to 12 in or deeper local test | Pre-plant or pre-sidedress | Interpret with rainfall and mineralization |
| No-till stratification check | 0 to 2 in plus 2 to 6 in | Before lime decisions | Surface acidity may hide in mixed samples |
| Pasture, orchard, and perennial beds | Root-zone depth used by lab | After grazing or harvest flush | Avoid manure bands, drip lines, and fertilizer streaks |
Match the lab method: Mehlich, Bray, Olsen, ammonium acetate, and other extractants are calibrated differently. Use the same lab and depth when comparing years.
Separate correction from maintenance: Lime, sulfur, build-up P or K, starter nutrients, and crop removal replacement are different decisions even when they appear on one soil report.
Soil test are documents that describe the chemical and physical properties of the soils. A person often ignores these soil tests until they have a fertilizer bill or a goal for the yield of there crops. The reading of the soil will provide information regarding the pH of the soil as well as the amount of potassium in the soil; however, each of these value will have different recommendations based off the crop that is being grown in each field.
For instance, there will be a need for different pH level in soil samples for alfalfa compared than fields in which blueberries are to be grown. The same is true for fields that is managed for corn as opposed to wheat or vegetables grown on raised beds with compost as opposed to pasture field. A soil test calculator can provide a person with a recommendation for each field based upon the soil test result.
How to Read Soil Tests
However, a person will still need to use their judgment to decide when to apply the fertilizer to the soil, the cost of applying that fertilizer to each field, and how to calibrate the soil test results of each field. The most important input to a soil test are the measurement of the soil’s capacity to hold nutrients. One of the most important measurements of soil is the CEC, or the soil’s Cation Exchange Capacity.
The CEC measure how many exchange sites are available within the soil for nutrients. The amount of organic matter within the soil is another important input for soil testing. The organic matter input determine how much biological activity will take place within the soil that will mineralize nitrogen.
The third measurement is the soil texture. The soil texture will determine how quick nitrate and potassium move through the soil. Additionally, the soil texture will determine whether nutrients will remain in clay soil fields or sandy fields.
These three soil measurements, along with measurements of the pH and phosphorus of the soil, will provide more information for a person than just the soil test results alone. The crop that is to be planted into each field will change each of the soil test value. For instance, alfalfa fields will require different pH levels than those field in which blueberries are to be planted.
The same is true of crops that contain different amounts of potassium requirements; corn requires more to remove the potassium from the soil than wheat does. Additionally, vegetables that are grown on raised beds with compost will have different recommendations than pasture fields that have been used for long period of time for livestock. While a soil test calculator can handle the calculations for each field given the crop that will be grown, a person will still have to make decisions regarding the soil and fertilizer based upon the rainfall or manure that falls on each field.
While a person may choose to sample soil at the same depth each growing season and each cycle, it is only after collecting soil test samples for three or four growing seasons that a person will be able to understand the soil well enough to make sound decisions regarding fertilizers and other soil treatments. The trend of the organic matter level in the soil will allow a farmer to understand whether any soil amendment programs to increase organic matter are working. Additionally, trends of the saturation level of the soil will allow the farmer to understand if any soil compaction or drainage issue are limiting the ability of nutrients to interact with the crops that are being grown in the fields.
One soil test will identify the problem, but repeated soil tests will reveal if the soil is moving in the right direction or if the soil is cycling through the same limitation. The reference tables use different rates than the laboratory tests for a few different reason. First, each laboratory can vary from the other.
For instance, the phosphorus level can mean maintenance on one farm but mean the soil will build up with phosphorus on another farm. The rates listed on the soil calculator are the common ranges used in the industry so people can understand where their soil fall in comparison with the needs of the crop. However, the local extension office and the cost of the fertilizer will determine where to take the soil.
A habit for a person is to separate the pH of the soil from the nutrients in the soil. For strongly acidic or alkaline soil, the nutrients will tie up in that soil even if the phosphorus and the micronutrients test high. In this situation, a person should of focus on correcting the pH of the soil first because this will reveal how much additional fertilizer is needed.
The soil test calculator will show the importance of the pH of the soil relative to the other measurements, but the decision of what to do will come from the person using the calculator. Another habit is to focus on the nitrate-nitrogen number in the soil test. This value can change based on the rainfall that falls between the time the soil was tested and the sidedress of nitrogen fertilizers to the fields.
Warm temperatures will also impact the supply of nitrogen in the soil because the higher the temperature, the faster the rate of mineralization of organic matter in the soil to plant available nitrogen. This measurement will use the nitrate-nitrogen value and the organic matter level in the soil. However, the person calculating the recommendation will also use their knowledge of the weather and the organic matter in the soil to make the decision.
The most useful pattern that will develop for a person is the pattern that show up when sampling the same field every year. The soil test calculator will provide the language for the soil test reports that a person will read each year. However, the most important finding in the soil test will be if the amount of organic matter and the pH of the soil are changing over time.
These changes in soil reveal to a person the long term health of that soil. While soil testing does not have a perfect number as the goal, the value of a soil test is in the understanding of what each soil test is measuring for the person making the management decision.