Nitrogen testing is a basic aspect of soil management that most gardeners overlook until their plants shows signs of stunted growth (or even turning more yellow than usual). A soil test color chart turns that guesswork into something you can actualy read by showing whether your soil is starving plants of nitrogen, holding just enough, or carrying far to much. Knowing what those colors mean will help you avoid overfeeding your crops and ensure the right amount of food for good crop production.
Why Nitrogen? Plants require it to form proteins and to produce chlorophyll. Too little nitrogen cause leaves to yellow; they will be slower growing and eventually start to lose their greenness. Too much: No good. Leaves is extra rich green (but not really) and stems grows soft. Flowering is delayed. The infographic shows this next to deficiency, so you can compare what you see with what the tests show.
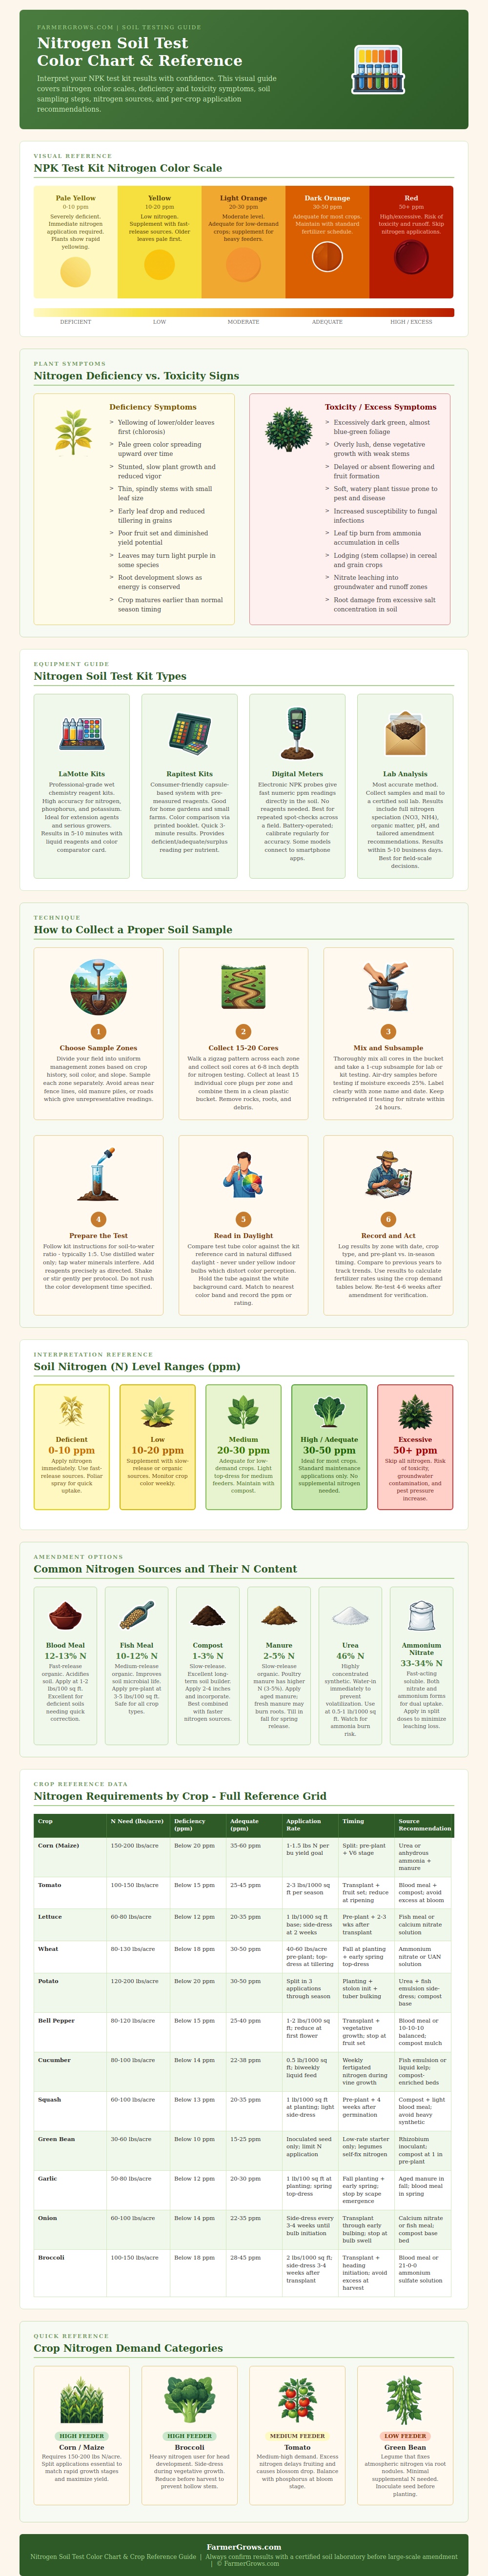
How to Use a Soil Test Color Chart
Why do both show up first on older leaves? Because those are being sacrificed to nourish new growth. Either extreme mean lower yields.
“People take samples all wrong, and then they have no use for their results.” It’s not enough to grab a scoopful from a garden corner; make sure you walk around the area on some kind of pattern, pull several core (mixing as you go) and test the combined sample. That’s the one you’ll treat, and the color will only mean something when it’s an average of your specific site.
Nitrogen requirements varies by crop; some plants is heavy-feeders, using up what’s there fast (broccoli, for instance, and corn). Others, such as legumes, fix it themselves through the nodules on their roots. Follow chart’s suggested range for your crop, then judge whether you want to apply just a little bit more on top, or more still.
When and how: Applying all at once can results in loss of nitrogen from volatilization or leaching, so split applications timed to correspond with growth stage help keep nitrogen where the plant can takes it up, in the root zone. Nitrogen from organic sources is released at a slower pace than synthetic kinds. If there’s a clear-cut deficiency in play, use something that kicks into gear quickly (like blood meal or fish meal), but for long-lasting reserves make sure to incorporate lots of well-rotted manure and compost. In general, raw organic stuff would of solved an emergency by itself.
Urea, a synthetic form, offers high concentration, but do be cautious with this one; it must be watered into soil, or it will run off. Typical nitrogen percentages for each type is what you see in the chart. Use this to pair your material to the need.
To see if your amendments are having the desired effect, use color chart as a guide that you can repeat: Apply, wait a few weeks, retest, and see how far the reading has changed. Did it shift up toward the adequate range? That’s a clue that you’ve applied enough and at the right time. Didn’t budge much or even get worse? Now you know for sure something needs tweaking. Taking repeated readings allows you to see patterns in soil over time, something no one-time test could possibly show.