Chicken Egg Calculator
Estimate egg count, dozens, hen-day laying rate, feed use, and carton-ready yield from flock size, breed, age, season, egg size, and handling loss.
Use the calculator for planning backyard, homestead, and small farm egg production. The result is an estimate: individual hens vary with nutrition, health, stress, weather, molt, and daylight.
Flock Egg Estimate
Calculated from breed annual output, age factor, season factor, active laying hens, handling loss, feed intake, and average egg size.
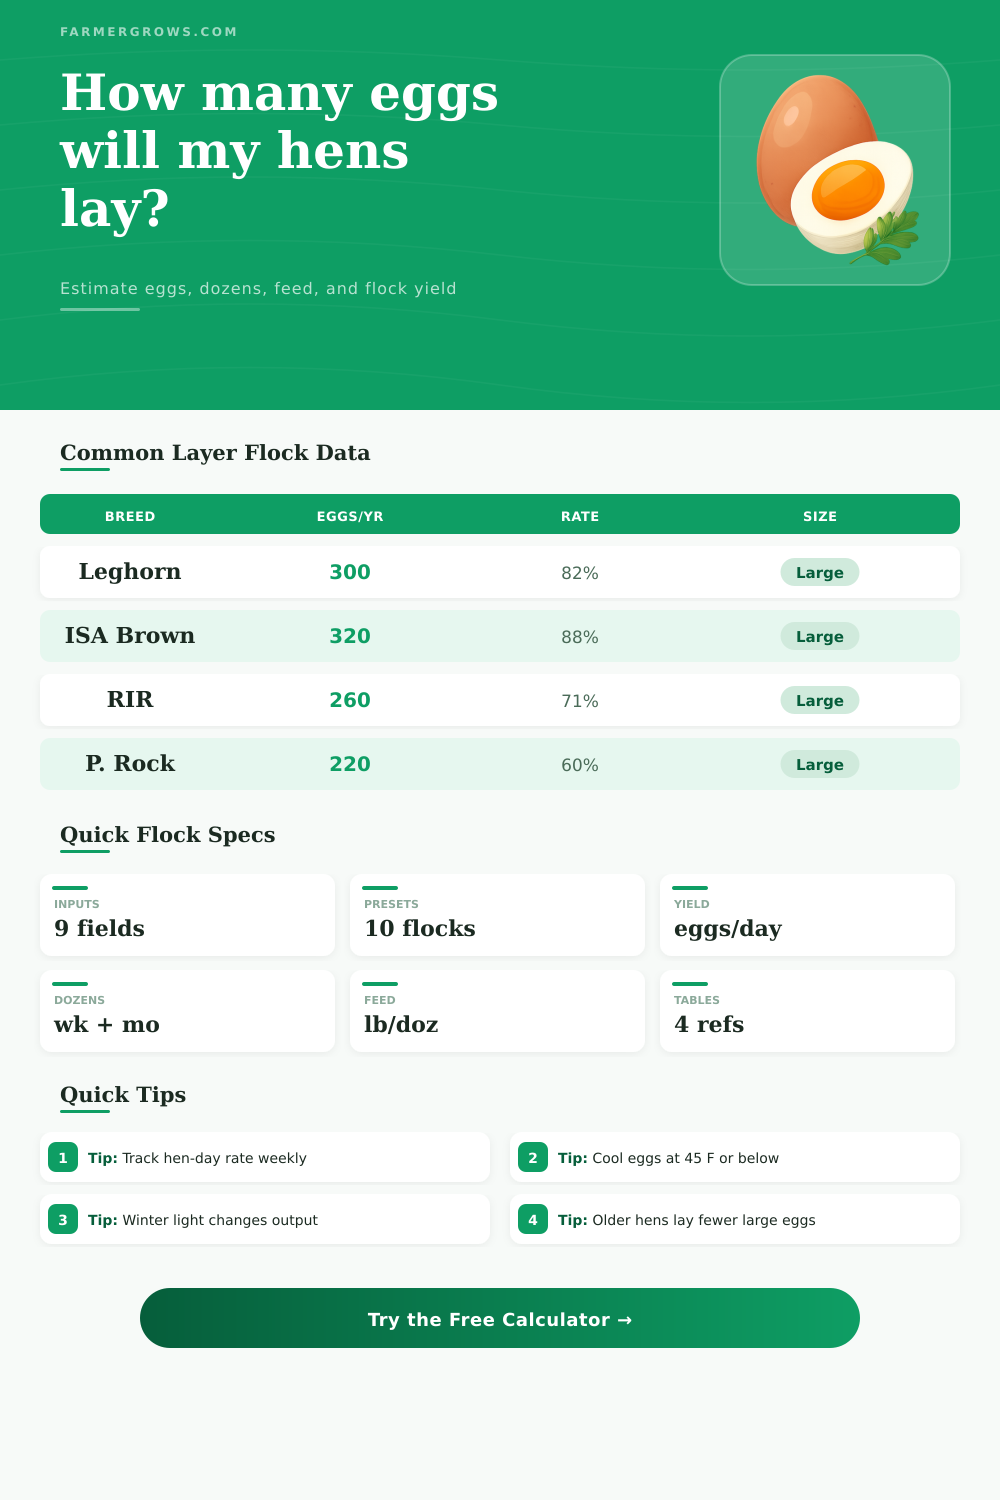
| Breed or flock type | Typical eggs per hen per year | Average daily rate | Common egg size | Typical feed per hen |
|---|---|---|---|---|
| White Leghorn | 280 to 320 | 77% to 88% | Large white | 3.5 to 4.0 oz/day |
| ISA Brown or red sex-link | 300 to 320 | 82% to 88% | Large brown | 4.0 to 4.4 oz/day |
| Rhode Island Red | 250 to 280 | 68% to 77% | Large brown | 4.0 to 4.5 oz/day |
| Australorp | 230 to 260 | 63% to 71% | Large brown | 4.2 to 4.7 oz/day |
| Plymouth Rock or Barred Rock | 200 to 240 | 55% to 66% | Large brown | 4.3 to 4.8 oz/day |
| Sussex | 220 to 250 | 60% to 68% | Large cream to brown | 4.2 to 4.7 oz/day |
| Wyandotte | 180 to 220 | 49% to 60% | Medium to large brown | 4.4 to 5.0 oz/day |
| Buff Orpington | 170 to 200 | 47% to 55% | Large light brown | 4.5 to 5.2 oz/day |
| Age or season condition | Calculator factor | Expected effect | Best use in planning |
|---|---|---|---|
| Under 18 weeks | 0% | Pullets usually not laying yet | Do not count as producing layers |
| 18 to 21 weeks | 35% | Point-of-lay ramp with smaller pullet eggs | Use for early startup estimates |
| 22 to 30 weeks | 85% | Rapid rise toward peak production | Good for first-carton planning |
| 31 to 52 weeks | 100% | Strong first-cycle production | Best window for peak estimates |
| 53 to 78 weeks | 88% | Output begins to settle after year one | Useful for second-season budgets |
| 79 to 104 weeks | 75% | Fewer eggs, often larger average size | Use for older backyard hens |
| Winter without added light | 55% | Short days reduce ovulation cycles | Use for natural-light flocks |
| Molt or recovery | 35% | Temporary laying pause or slow return | Use during feather regrowth periods |
| Egg size class | Minimum dozen weight | Approximate weight per egg | Dozen yield note |
|---|---|---|---|
| Pullet / peewee planning | 15 oz/dozen | 1.25 oz | Common during early laying ramp |
| Small | 18 oz/dozen | 1.50 oz | Often young hens or light breeds |
| Medium | 21 oz/dozen | 1.75 oz | Useful for mixed-size family cartons |
| Large | 24 oz/dozen | 2.00 oz | Common market and kitchen target |
| Extra large | 27 oz/dozen | 2.25 oz | Often older or hybrid layers |
| Jumbo | 30 oz/dozen | 2.50 oz | Less common, watch shell quality |
| Handling or storage item | Practical value | Calculator connection | Flock management note |
|---|---|---|---|
| Refrigerated storage | 45 F or below | Protects usable yield after collection | Cool promptly and keep cartons in the main refrigerator area |
| Collection frequency | Daily or more often | Lowers cracked, dirty, and hidden nest loss | Increase collection in hot or freezing weather |
| Nest boxes | 1 box per 4 to 5 hens | Helps reduce dirty eggs and floor eggs | Keep nesting material dry and inviting |
| Feed conversion | About 3 to 5 lb feed per dozen | Shown as feed per dozen result | Worse numbers can signal low lay rate or excess waste |
| Water access | Always available | Indirect effect on hen-day rate | Frozen, hot, or empty waterers quickly reduce lay |
| Carton math | Eggs divided by 12 | Dozens per week and period | Use tray count for 30-egg farm flats |
For cleaner estimates: Compare the calculator to your own seven-day egg log. Adjust the off-lay and loss percentages until the model matches your actual flock.
For storage planning: Egg count is only useful if the eggs stay clean, cool, and traceable. Record collection date, flock group, and carton count each day.
That’s the question every backyard flock asks: How many eggs? And you ask it, too: What will these hens produce for me this month?
The number of eggs you’ll haul home depends on several things. It varies by flock size or even breed as well as by age and length of daylight. It also depend on the quality of their feed and even whether or not you collect them regularaly.
How to Plan Your Egg Harvest
That’s why a planning tool can be helpful. It helps turn your vague hopes into something real, an estimate that you can use… Without having to break out the spreadsheet.
What actualy moves production is what goes in the calculator’s input fields. The genetic ceiling are set by breed. Age shows if the birds are climbing up to peak output, sitting still, or starting to slide into a day-after-day decrease during their second or third year. Season captures that wild swing between long spring days and short winter days. Off-lay percentage acknowledges that some broody, molting or stressed-out hens aren’t contributing yet. Loss percentage covers those missing eggs (or dirty egg or cracked shells). Neither factor is dramatic in isolation, but each one collectively determine whether you’re collecting a half-dozen a week or barely two-dozen.
The most important variable is the amount of feed consumed by each hen per day. That’s what impacts the “feed-per-dozen” answer the calculator provides. That number indicates how efficient your hens are, or aren’t: Higher = more wasteful; lower = better. When that number rise, then look at wasted feed or low production as the culprit.
Egg size alters equation too, since bigger eggs weigh more per dozen. That becomes an issue when calculating overall yield (for sale or storing). Finally, the carton size allow you to convert your eggs to the sizes in which they’re sold (a 30-egg tray? Is it a standard dozen? Frictionless yields is what’s theoretically possible, or how many gross eggs might be laid before some losses occur.
These are your adjusted results. What will you get? Plan around these. How much feed went into this batch? How many did this flock lay per day or week? The laying rate percentage show in what range those results fall relative to the breed average. Is your flock performing above, at, or below its breed average for age and season? You need this to see whether your flock is performing at, above, or below its breed average for that season and age.
Feed conversion: What’s the cost side of the picture like? One number tell it all. And then there are reference tables, which I rely on at times to check against different breeds or sanity-check whatever number is coming back. It breaks down what ages and seasons the calculator considers, how much it produces in a year, and the range of that output so you can get an idea of where yours might differ.
This may help you decide if you are choosing a calm heritage breed that produce fewer eggs but offers other perks you value more different than productivity. Nope. Not quite. There’s no way to account for personality differences between hens, for the changes in the weather, for predator stress or nutritional factors in the real-world flock, as compared to the idealized one in the model.
Instead, the helpful exercise is to run the calculation and plot it against your own actual egg data (i.e., keep an egg log for a week). Then tweak the inactive/loss percentages till the model matches your reality. Do this a time or two and you’ll have an idea about what works best based off your system.
Perfect prediction isn’t the point. Perfect prediction is impossible. What we’re doing is eliminating the most surprising factors so you don’t have to guess about how much space you need in your carts or how many feed bags to buy or what size containers to order for storage. After a while, the day-to-day rhythm of feeding will stabilize and that’s when the other stuff won’t be so mysterious anymore but just plain doable.
You should of seen the results sooner.