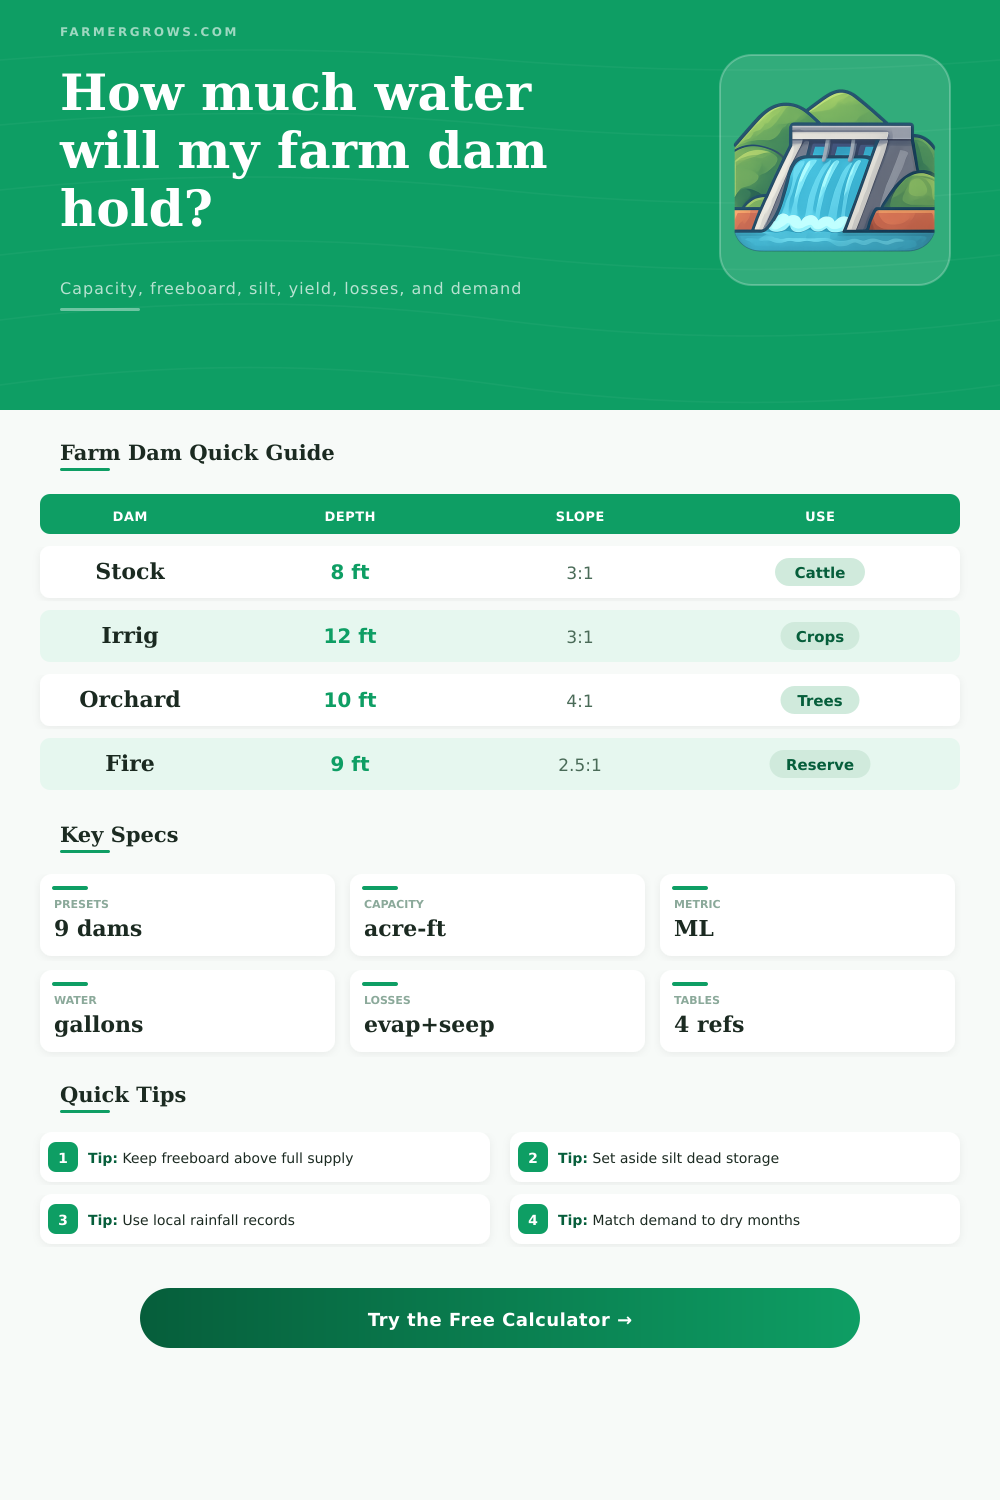
Dam Capacity Calculator
Estimate farm dam storage from shape, top and bottom dimensions, depth, side slopes, freeboard, silt allowance, catchment yield, evaporation, seepage, livestock demand, and irrigation demand.
Load a common farm water storage case, then adjust the dam dimensions, catchment, expected losses, silt reserve, and water demand for your site.
Dam Capacity Results
Capacity is estimated with the prismoidal frustum formula, then adjusted for silt reserve, operating reserve, catchment yield, evaporation, seepage, livestock demand, and irrigation demand.
| Shape | Top area used | Bottom area used | Volume formula | Best field measurement |
|---|---|---|---|---|
| Rectangular | Top length x top width | Bottom length x bottom width | Depth / 3 x (A1 + A2 + sqrt(A1 x A2)) | Tape, GPS, or survey shots along banks |
| Oval | Pi x long axis x short axis / 4 | Pi x floor long axis x floor short axis / 4 | Same frustum formula with oval areas | Measure long and short waterline axes |
| Round | Pi x diameter squared / 4 | Pi x floor diameter squared / 4 | Same frustum formula with circle areas | Average two diameter measurements |
| Custom | Entered top surface area | Entered bottom surface area | Surveyed area frustum | Drone map, contour plan, or GPS polygon |
| Catchment cover | Runoff coefficient | Collection efficiency | Typical note |
|---|---|---|---|
| Good pasture or grassed slope | 0.10 to 0.30 | 70% to 90% | Soil infiltration and plant cover reduce direct runoff |
| Clay paddock or compacted lane | 0.25 to 0.55 | 75% to 90% | Higher yield after repeated rain or on tight soils |
| Farmyard, roof, or hardstand | 0.65 to 0.95 | 85% to 98% | Check first-flush diversion and inlet erosion control |
| Mixed farm catchment | 0.20 to 0.45 | 75% to 90% | Use a weighted coefficient by land cover area |
| Water use | Planning value | Seasonal adjustment | Field check |
|---|---|---|---|
| Beef cattle | 10 to 20 gal/head/day | Hot weather and lactation can push higher | Keep trough and pipe capacity above peak demand |
| Dairy cattle | 25 to 50 gal/head/day | Milk production and heat load matter | Use herd records when available |
| Sheep or goats | 1 to 3 gal/head/day | Dry feed and summer heat increase demand | Plan for access and water quality |
| Irrigation | 0.5 to 1.5 in/week | Crop, soil, mulch, and rain alter the draw | Convert weekly depth to acre-ft over the irrigated area |
| Design allowance | Common range | Why it matters | Calculator input |
|---|---|---|---|
| Freeboard | 1 to 3 ft | Reduces overtopping risk from wind, wave, storm inflow, and settlement | Freeboard above spillway |
| Silt storage | 0.5 to 2 ft | Keeps sediment from being counted as usable water | Silt allowance depth |
| Side slope | 2:1 to 5:1 | Controls bank footprint, safety, and erosion risk | Side slope H:1V |
| Evaporation plus seepage | 2 to 12 in/month | Can dominate dry-season storage in shallow dams | Evaporation and seepage loss |
Small errors in waterline area, floor area, or side slope multiply through the depth. Use surveyed contours for final dam construction or permitting decisions.
A dam may hold enough water on paper but still fall short if catchment yield arrives after peak demand. Compare dry-month demand with actual refill timing.
This estimator supports planning and comparison. Dam safety, spillway sizing, embankment design, water rights, and environmental rules should be checked with local professionals and agencies.
A farm dam is a structures that stores water for various purposes. Spesifically, a farm dam will store water that are used for livestock, crops, and for emergency reserves. A farm dam is important to a farm because it will store water that can be used during dry period of the year when there is no rainfall.
When building a farm dam, it is important to ensure that the size of the dam is correct. If the dam is too small, it will not provide enough water for the farms need. However, if the dam is too large, then the farm will have to spend money purchasing land to build those necessary earthwork for the dam.
How to Plan and Size a Farm Dam
Therefore, it is important for the farm owner to calculate how much water will be stored and how much water the dam will deliver to ensure that the dam is useful. The volume of the farm dam is determined by the shape of the excavation of the dam. The shape of the excavation will have the most direct impact upon the total volume of the dam.
Rectangular hole are the easiest to measure. However, farm dams often have livestock and experience the weather, which can affect the bank of the dam. The area of the water surface will change with the depth of the water.
Therefore, the area of the dam that should be used in calculating the volume is one that include both the area of the top of the dam and the area of the bottom of the dam. The gross capacity of the area will have to be calculated to determine how much usable water the farm dam will have. There will be sediment that settles at the bottom of the dam over time.
Therefore, allowances will have to be made for sediment settling in the calculation of the usable water volume. Finally, there will be freeboard that will be created above the spillway of the dam. This freeboard will protect the banks of the dam from the water that may splash against the bank of the dam.
Catchment yield is the amount of water that will fall onto the farm dam from the land surrounding the farm dam. The catchment yield will vary according to the type of ground that is within the catchment area. For example, if the land is covered in clay, the runoff that will reach the farm dam will be different than if the land is covered in grass pastures.
Additionally, rainfall will produce different amount of runoff on compacted clay than it will on grass pastures. Therefore, the coefficient of runoff will impact the amount of water that will enter the farm dam. If the coefficient is small, then the amount of water that falls onto the farm dam is small.
Because of this, many plans for farms fail to account for how rainfall does not all become inflow into the farm dam. Therefore, the use of a calculator to calculate the runoff coefficient can save the dam owner from performing the necessary calculations themselfs. Beyond the water that evaporates from the surface of the farm dam, there may also be a loss of water to the floor and bank of the dam.
This loss of water through seepage is most significantly in shallow dams or in dams constructed upon light soil. The losses of water through evaporation and seepage will need to be accounted for in relation to the amount of water that the farms livestock and irrigation system will demand. The difference between these two amount will reveal to the farm owner whether or not the farm dam will be able to supply enough water to the farm during the planning period.
A positive calculation of the water supply is not a guarantee of the supply of enough water for the farms needs if the timing of when the water refills within the dam does not match with the timing of the water demands of the farm. Therefore, it is necessary to calculate the demand for water within the specific window of time that the farm dam will be required to provide enough water for the farm to operate alone. Common allowances will be required in the building of a farm dam.
For example, there will need to be one or two feet of freeboard created above the spillway to ensure that the dam does not overtop during period of heavy rainfall. The side slope of the dam should be relatively flat to avoid slumping of the bank of the dam when the water levels drop. Finally, it is also necessary to consider the depth at which the land will be irrigated.
The calculation of the various numbers for the farm dam will reveal to the dam owner how the stored volume of water will be used, and how much of that stored volume will be protected for the various uses of the dam. If any of the variable of the dam are changed, such as the silt allowance or the runoff coefficient, the results that are obtained for the dam will change. Such a change in the results of the calculations will reveal to the dam owner the impact that each of those variable will have upon the dam.
Therefore, it is important for the dam to include a margin of error within its design. This margin of error can be tested using a calculator prior to any soil being moved to create the dam. Testing for the effect of different margins within the design of the dam with the use of a calculator is a far less costly alternative to testing for those effect after any soil has been moved as part of its construction.
You should of checked the math first.