Soil Texture Triangle Calculator
Classify sand, silt, and clay with the USDA triangle. Compare boundary samples, optional sand fractions, and quick reference tables for faster field calls.
Pick a sample that behaves like a real USDA triangle point. Each preset fills the main fractions, the normalization mode, the tolerance band, and a sand-fraction sketch.
Triangle rule: the class uses normalized sand, silt, and clay percentages that add to 100. When totals drift, the calculator corrects them and reports the adjustment.
Optional sand fraction detail
Soil Triangle Output
USDA-style classing from the normalized sample, with boundary notes and the closest broad family.
| Class | Clay cue | Sand or silt cue | Family |
|---|---|---|---|
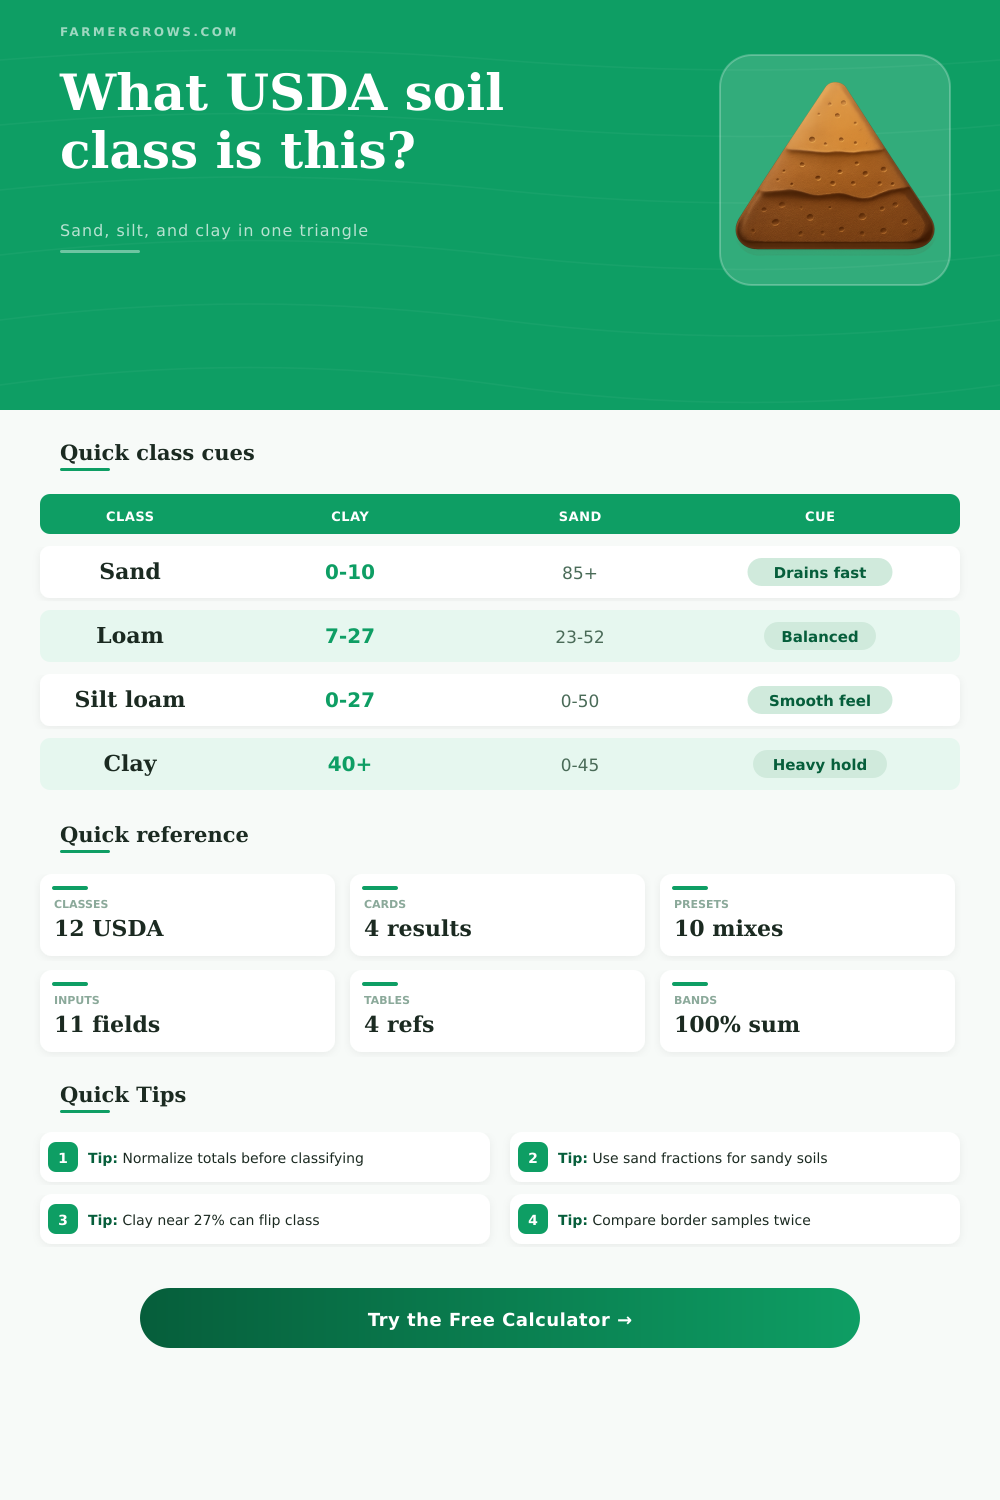
| Sand | 0-10% | 85%+ sand | Coarse |
| Loamy sand | 0-15% | 70-89% sand | Coarse |
| Sandy loam | Under 20% | 43-85% sand | Moderately coarse |
| Loam | 7-27% | 23-52% sand | Medium |
| Silt loam | 0-27% | 50-88% silt | Medium |
| Silt | Under 12% | 80%+ silt | Medium |
| Sandy clay loam | 20-35% | 45-65% sand | Moderately fine |
| Clay loam | 27-40% | 20-45% sand | Moderately fine |
| Silty clay loam | 27-40% | 40-73% silt | Moderately fine |
| Sandy clay | 35-55% | 45%+ sand | Fine |
| Silty clay | 40-60% | 40%+ silt | Fine |
| Clay | 40%+ | 0-45% sand | Fine |
| Family | Common classes | Water feel | Workability |
|---|---|---|---|
| Coarse | Sand, loamy sand | Very quick drainage | Loose and dry |
| Moderately coarse | Sandy loam | Fast but usable | Easy to dig |
| Medium | Loam, silt loam, silt | Balanced storage | Flexible tilth |
| Moderately fine | Sandy clay loam, clay loam, silty clay loam | More water hold | Needs care |
| Fine | Sandy clay, silty clay, clay | Slow drainage | Sticky when wet |
| Border zone | Example mix | Watch for | Near neighbors |
|---|---|---|---|
| Sand corner | 90/5/5 | Little clay hold | Loamy sand, silt |
| Silt edge | 10/80/10 | Smooth feel | Silt loam, loam |
| Clay edge | 20/20/60 | High plasticity | Silty clay, clay |
| Balanced center | 40/40/20 | Two fractions tie | Loam, clay loam |
| Fraction | Size band | Texture cue | Use |
|---|---|---|---|
| Very fine sand | Lowest band | Finer feel | Softens mix |
| Fine sand | Small band | Close packing | Adds smoothness |
| Medium sand | Middle band | Neutral bias | Main sand core |
| Coarse sand | Larger band | More grit | Raises drain speed |
| Very coarse sand | Top band | Very gritty | Sharpens drainage |
Soil texture are a classification of soil based on the different sizes of particles within that soil. Soil contain three different types of primary particles: sand, silt, and clay. Sand is the largest of these particles, allowing for the movement of water and air through the soil.
Silt particles is medium sized and feel smoothly when dry. Clay particles are the smallest of the three primary soil particles, allowing the soil to hold onto water and nutrients very effective. Because sand, silt, and clay have different sizes, the combination of those three different particles within soil determine it’s texture.
Soil Texture and How to Test It
To determine the texture of soil, the USDA soil texture triangle can be use. The USDA soil texture triangle is a visual diagram that use the percentages of sand, silt, and clay within the soil sample to find the classification of that soil. To use the USDA soil texture triangle, the user must enter the percentage of sand, silt, and clay in the soil sample into a calculator.
If the percentages of those three soil particle types does not add up to 100%, the calculator will perform a process called normalization. Normalization is the mathematical process of adjusting the raw numbers of sand, silt, and clay percentages to ensure they fits within the requirements of the soil texture triangle. Soil of different textures will exhibit different behaviors when managing the soil.
Soils with coarse textures, such as sand or loamy sand, will have a high percentage of sand within them. Coarse textures will allow water to drain at a very fastly rate through the soil due to the gaps between sand particles. Soils with fine textures, like clay, will have a high percentage of clay within the soil sample.
Fine textures will hold large amount of water and nutrients within the soil due to the tight packing of clay particles. Medium textures, like loam, has a balanced amount of sand, silt, and clay within the soil sample. Soils of this texture is often considered to be ideal for agriculture.
Soils with fine textures must be manage with care, as these soils may become waterlogged. Waterlogged soil prevents the exchange of gas between the soil and plant roots, preventing the roots from receiving the oxygen they need to perform crucial cellular function. Beyond using the USDA soil texture triangle to determine soil texture, there is other details that can help to understand soil texture.
One of these detail is information on the physical feel of sand. Sand can be very coarse or very fine in texture. Very coarse sand will allow water to drain at a fasterer rate than very fine sand.
Additionally, soil sample may fall into boundary zone within the soil texture triangle. Boundary zones are area within the triangle where the soil sample fall on the line between two different types of soil texture. In these cases, a boundary tolerance can be use to determine if the soil sample is of one type or if it is close to being another type of soil.
Finally, you can physically feel soil texture to determine if the information from the soil texture calculator is accurate. For example, if the soil sample feels like clay but the calculator read sandy loam soil, the soil sample should of been examined once more for accuracy. By understanding the texture of the soil in which plants will be grow, farmers can better predict how that soil will react to water and fertilizer, and better manage that soil.