🌱 Fertilizer Blend Analysis Calculator
Analyze your custom fertilizer blend — get NPK ratios, nutrient percentages, and application rates instantly
Add each fertilizer ingredient. Enter its proportion by weight (%) and NPK analysis values.
| Fertilizer Source | N (%) | P₂O₅ (%) | K₂O (%) | Density (lbs/ton) | Notes |
|---|---|---|---|---|---|
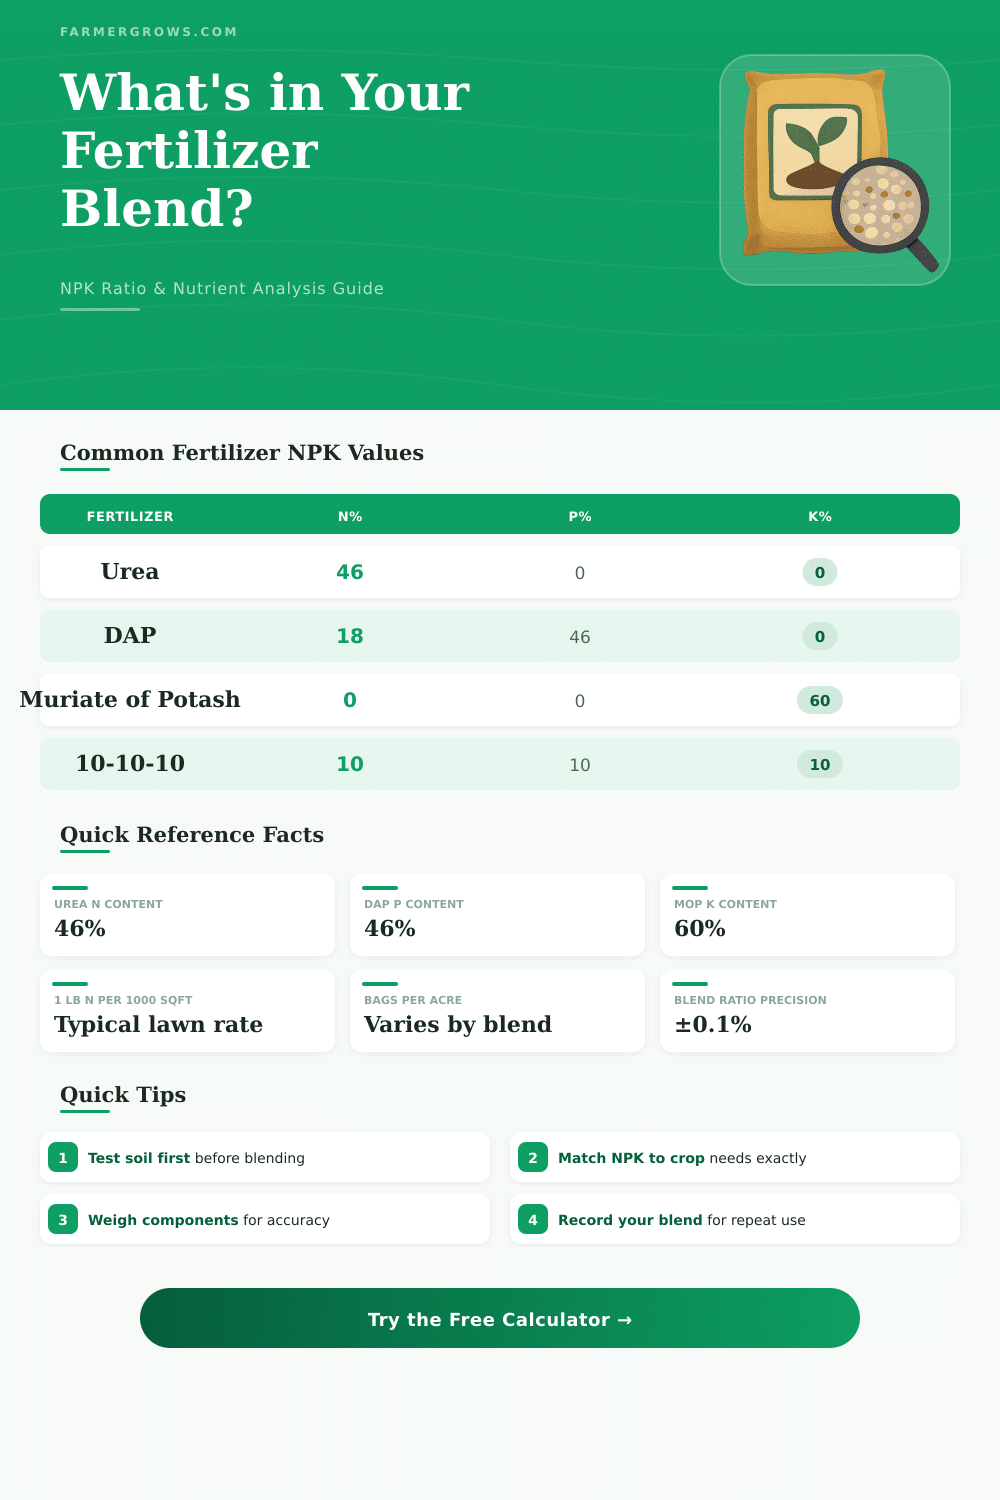
| Urea | 46 | 0 | 0 | 2000 | Most concentrated N source |
| Ammonium Nitrate | 34 | 0 | 0 | 2000 | Fast-release N |
| Ammonium Sulfate | 21 | 0 | 0 | 2000 | Adds 24% S; acidifying |
| DAP (Di-Ammonium Phosphate) | 18 | 46 | 0 | 2000 | High P starter |
| MAP (Mono-Ammonium Phosphate) | 11 | 52 | 0 | 2000 | Low pH; good starter |
| Triple Super Phosphate (TSP) | 0 | 46 | 0 | 2000 | Pure P source, no N |
| Muriate of Potash (MOP) | 0 | 0 | 60 | 2000 | Most common K source |
| Sulfate of Potash (SOP) | 0 | 0 | 50 | 2000 | Chloride-free; premium |
| Potassium Nitrate | 13 | 0 | 44 | 2000 | N + K; soluble grade |
| Calcium Nitrate | 15.5 | 0 | 0 | 2000 | Also provides Ca |
| Organic Compost | 1.5 | 1 | 1 | 1600 | Slow release; variable |
| Blood Meal | 12 | 0 | 0 | 2000 | Organic fast N |
| Bone Meal | 3 | 15 | 0 | 2000 | Organic P source |
| Kelp Meal | 1 | 0.5 | 2 | 2000 | Trace elements; organic |
| Rate (lbs/acre) | Rate (kg/ha) | Rate (lbs/1000 sq ft) | Rate (g/m²) | Typical Use |
|---|---|---|---|---|
| 50 | 56 | 1.15 | 5.6 | Maintenance fertilization |
| 100 | 112 | 2.30 | 11.2 | Light lawn feeding |
| 200 | 224 | 4.59 | 22.4 | Standard crop application |
| 300 | 336 | 6.89 | 33.6 | High-demand crops |
| 400 | 449 | 9.18 | 44.9 | Heavy feeding / base dress |
| 500 | 561 | 11.48 | 56.1 | Maximum typical rate |
| 1000 | 1121 | 22.96 | 112.1 | Compost / organic matter |
| Nutrient | Fertilizer Label | To Convert | Multiply By | Example |
|---|---|---|---|---|
| Phosphorus (P) | P₂O₅ | P₂O₅ → P | 0.4364 | 46% P₂O₅ = 20.1% P |
| Phosphorus (P) | P₂O₅ | P → P₂O₅ | 2.2913 | 20% P = 45.8% P₂O₅ |
| Potassium (K) | K₂O | K₂O → K | 0.8301 | 60% K₂O = 49.8% K |
| Potassium (K) | K₂O | K → K₂O | 1.2046 | 50% K = 60.2% K₂O |
| Sulfur (S) | SO₃ | SO₃ → S | 0.4005 | 24% SO₃ = 9.6% S |
| Calcium (Ca) | CaO | CaO → Ca | 0.7147 | 28% CaO = 20% Ca |
| Crop / Use | N (lbs/acre) | P₂O₅ (lbs/acre) | K₂O (lbs/acre) | Growth Stage |
|---|---|---|---|---|
| Corn (Maize) | 150–200 | 60–80 | 80–120 | Pre-plant + side-dress |
| Wheat | 60–120 | 40–60 | 40–60 | Pre-plant |
| Soybeans | 0–20 | 50–80 | 80–120 | Pre-plant (low N) |
| Potatoes | 150–200 | 100–150 | 200–250 | Split applications |
| Tomatoes (field) | 100–150 | 80–100 | 150–200 | Multiple splits |
| Lawn (cool season) | 3–5 lbs N/1000 sqft/yr | Low | Moderate | Fall primary |
| Citrus | 1–1.5 lbs N/tree/yr | Moderate | Moderate | Split 3-4x/yr |
| Pasture Grass | 50–100 | 20–40 | 40–60 | Spring + Fall |
Analysis of Fertilizer blend turns around the idea of what nutrients are present in it and how much of each. Always one notes the content of nutrients in fertilizers by means of percentages of N, P2O5 and K2O, in that order. Those three figures outline the traits of any fertilizer product.
The amounts of every nutrient show themselves as percentages of the whole mass. For instance a ten-pound bag with 10-10-10 fertilizer carry one pound each of nitrogen, phosphorus and potassium. Math like this simple clicks in mind, when one grasps the idea.
How to Read N, P and K and Mix Fertilizers
Here useful example. Hundred pounds of 18-46-0 dry fertilizer store 18 pounds of whole nitrogen, 46 pounds of available phosphate and none of soluble potash. One gets that by means of multiplying the percentages against the whole weight.
When one mixes equal parts from 18-46-0 and 0-0-60, the fnial mix gets label 9-23-30.
Between common basic fertilizers find yourself urea in 46-0-0, DAP in 18-46-0, MAP in 11-52-0 and potash in 0-0-60. One mixes those bases to form usual combinations, as 19-19-19 or 24-24-10. Everything deals about the matching of amounts to reach the wanted values.
During building of mix, one should go from right to left. Set sulphur first, later potassium, then phosphorus and ultimately nitrogen. When some fertilizer in the mix have more than one nutrient, one must take the extra amounts from the target need.
Phosphate products commonly bare little nitrogen as bonus.
Full fertilizer delivers the three main nutrients. Mix 5-10-5 for flowering stresses more phosphorus for roots and flower growth, while it still gives nitrogen and potassium. Mixes with high potassium back the look of flowers and fruits.
If one adds element as iron, one must reduce another. Everything is between give and take.
Some crops react strongly to fertilizers. Too much nitrogen can cause chemical wounds. Various seasons require different doses.
Applying nitrogen when plants should rest is mistake.
There are resources for help in that. Calculator for dry fertilizer helps to create precise and cheap mixes, reaching nutrient targets each acre. Fast calculator for Fertilizer blend allows the user to form one source from complex mix.
One can enter amounts and costs in US or metric units, and the output follows the chosen units. Open entry of NPK values helps to estimate mixes for a certain amount, while guided entry uses a league to compile amounts according to seasonal needs, after one removes other inputs as manure.
Although one knows the percentage, that calculation works for any fertilizer, whether organic, mineral or fake. Even one grain can be designed with complex analysis of N, P, K and S, instead of mix different granules. One reaches mixed formulas by means of simple physical blending of various common fertilizers, withoutchemical reactions.
Tests of soil help to decide, what mix truly answers for a certain case.