AUM Grazing Calculator
Estimate animal unit months, stocking rate, grazing days, and acreage needs from forage production, utilization, livestock class, pasture condition, and reserve settings.
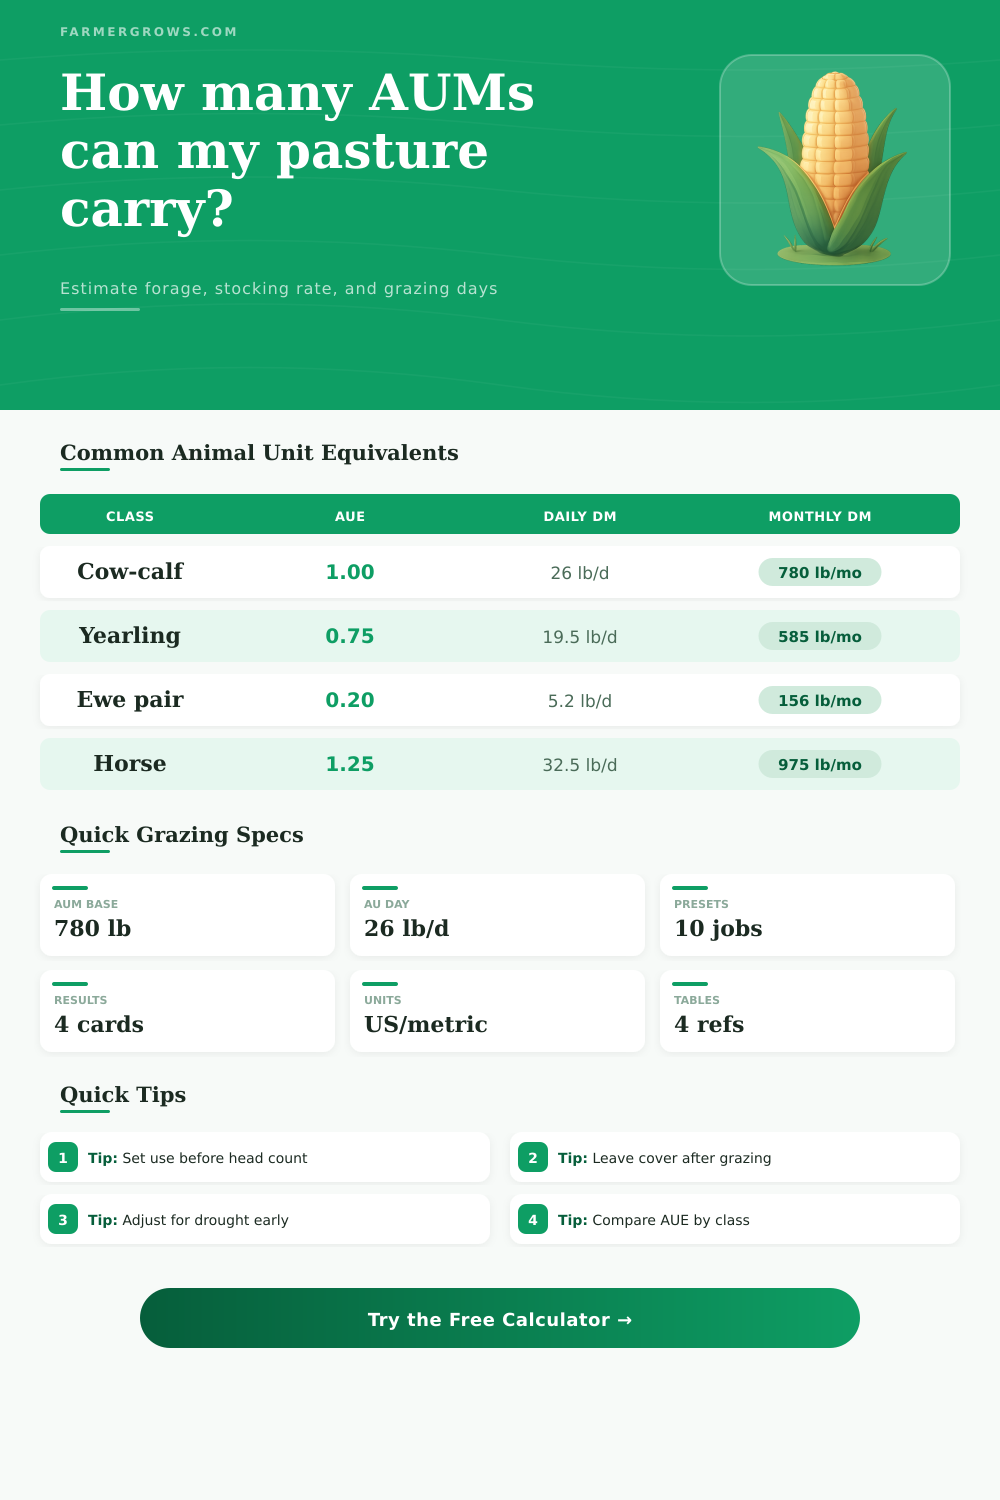
Use measured forage production when possible. This calculator treats one animal unit as the forage demand of a 1,000 lb cow with calf, equal to about 26 lb dry matter per day or 780 lb per 30-day month.
Standard AUM base. One pair for 30 days is one AUM when forage intake is 780 lb dry matter.
Useful for stocker calculations. Four yearlings need about the same forage as three animal units.
Five ewe-lamb pairs roughly equal one animal unit, before adjusting for terrain and plant selectivity.
Mature horses often require a larger forage allowance than a standard animal unit.
Grazing Capacity Results
Results use dry matter forage, animal unit equivalents, and the usable forage settings entered above.
| Livestock class | AUE used | Daily dry matter | Monthly dry matter | Animals per AU |
|---|---|---|---|---|
| Cow-calf pair, 1,000 lb cow | 1.00 | 26.0 lb/day | 780 lb/month | 1.00 |
| Dry cow, 1,000 lb | 0.85 | 22.1 lb/day | 663 lb/month | 1.18 |
| Cow-calf pair, 1,200 lb cow | 1.20 | 31.2 lb/day | 936 lb/month | 0.83 |
| Mature bull | 1.50 | 39.0 lb/day | 1,170 lb/month | 0.67 |
| Yearling cattle, 12 to 17 months | 0.75 | 19.5 lb/day | 585 lb/month | 1.33 |
| Weaned calf to 12 months | 0.60 | 15.6 lb/day | 468 lb/month | 1.67 |
| Ewe with lamb | 0.20 | 5.2 lb/day | 156 lb/month | 5.00 |
| Mature goat with kid | 0.17 | 4.4 lb/day | 133 lb/month | 5.88 |
| Mature horse, about 1,100 lb | 1.25 | 32.5 lb/day | 975 lb/month | 0.80 |
| Forage production class | Approx. yield | 35% usable forage | AUM per acre | Acres per AUM |
|---|---|---|---|---|
| Dry shortgrass range | 600 lb DM/acre | 210 lb/acre | 0.27 | 3.71 |
| Mixed grass range | 1,200 lb DM/acre | 420 lb/acre | 0.54 | 1.86 |
| Good native prairie | 1,800 lb DM/acre | 630 lb/acre | 0.81 | 1.24 |
| Improved cool-season pasture | 3,000 lb DM/acre | 1,050 lb/acre | 1.35 | 0.74 |
| Irrigated grass-legume pasture | 5,000 lb DM/acre | 1,750 lb/acre | 2.24 | 0.45 |
| Grazing situation | Typical utilization | Residual stubble target | Use in calculator | Field note |
|---|---|---|---|---|
| Continuous native range | 25% to 35% | 3 to 5 inches | Lower use, add reserve | Protects roots and soil cover through dry spells |
| Deferred rotation | 35% to 45% | 3 to 4 inches | Moderate use | Rest periods improve regrowth opportunity |
| Planned rotational pasture | 40% to 55% | 4 to 6 inches | Use with good recovery | Move based on plant height, not the calendar alone |
| Dormant stockpile | 50% to 65% | 2 to 4 inches | Higher use possible | Regrowth is delayed until the next growing season |
| Drought or weak stand | 15% to 30% | 4 to 8 inches | Reduce use sharply | Conservative use helps plants recover after rain |
| Pasture condition | Adjustment factor | Stocking-rate signal | Residual warning | Best next check |
|---|---|---|---|---|
| Excellent | 1.00 | Use measured production | Maintain key species height | Repeat photo points and cage clips |
| Good | 0.90 | Slightly conservative | Watch preferred plants first | Check distribution around water |
| Fair | 0.75 | Reduce head or days | Leave extra leaf area | Plan rest before seed set |
| Poor | 0.55 | Major stocking reduction | Avoid repeat close grazing | Identify bare ground and weeds |
| Drought stressed | 0.45 | Use emergency trigger dates | Keep protective cover | Recalculate after each rain event |
Before turnout: Recalculate with current-year forage, not a long-term average, when drought, late green-up, wildfire, hail, or heavy wildlife use has changed the available dry matter.
During grazing: Compare the calculated end date with residual stubble checks. If key plants are shorter than planned, pull animals even when the AUM balance says days remain.
Then one dry month turns your lush pasture sparse and you get it, carrying capacity matters. But what’s the carrying capacity? How much forage are you going to have in there, and for how long? How does all this work?
Basically, an animal unit month is a way of translating different livestock classes into a common measure for forage demand. A kind of yardstick for all to use. Terrain, growth stage, and yes, even the animals themselves comes into play, too. When your pastures don’t meet those average numbers in a text book, that’s where the fun starts. The difference between one field with good water access and deeper soil versus another a mile down the road can mean a field yielding double the dry matter.
How to Calculate Your Pasture Capacity
Then there’s also your grazing system: Planned rotation allows plants time to recover, often supporting higher total use without damage; continuous grazing doesn’t spreads its use evenly at all. Once you input your real-world conditions. Measured production on each acre and the tweaks based off condition and system (the calculator will do the rest). More importantly: Those tweaks need to reflect reality, not what you’d like your pasture to be.
People are surprised at how livestock class affects the balance. For example, a horse eats more than a typical cow-calf pair; a yearling eat less than a mature bull. If you combine classes on a given pasture, it doesn’t matter if you have the same number of animals; the total demand change. Therefore, you can select or override animal unit equivalence from the tool. On the page itself is the reference tables which show you the common conversions so you don’t need to memorize the coefficients to get an idea of where your herd fits with the base unit.
The other variable most folks have locked into place but shouldn’t is the utilization rate. On many rangeland situation, we’ll start with 35 percent, but if you’re already standing in a thin stand, or your growing season was shortened by drought, that figure go down fast. You don’t waste any production leaving some of that forage to recover, roots and wildlife. That’s insurance for the next dry spell, or the next guess at turnout date.
Similarly, the reserve and loss fields is there because if you don’t set aside a reserve percentage, you’ll never have any left when the animals come along, thanks to trampling, uneven distribution and wildlife use. If you want some extra food in reserve, plan for that by setting something aside rather than finding out later you didn’t account for that “invisible” deduction.
In the same way, you have a target for the stubble length. It makes an otherwise abstract “percentage” into something tangible… A visible measurement that can be checked against your boot or a ruler.
After those calculations come in, it’s time to roll up your sleeves and get to it. Now, you’re comparing the expected grazing days to what the plants are (or aren’t) doing. If a critical species is not being grazed as short as expected, you’ll move them out, even if there are still days on the board. Conversely, if something is growing faster than expected, you have already accounted for the usual things that throw off an estimate, so you can feel more certain about adding animals or simply extending the period.
What distinguishes sustainable systems from ones where they run out over and over again is that they’re willing to adjust if the conditions change. One rainy day, one unexpected heat wave. These are enough to change the output and require recalculating your inputs. And the tool just enables you to do that quick enough so that you would of it rather than guess.