Tube Feed Calculator
Estimate farm feed tube and auger delivery rate from tube diameter, line length, bulk density, fill level, pitch, rpm, incline, motor run time, and ration demand.
This farm calculator is for grain, pellet, mash, mineral, and livestock feed delivery lines. Use it for planning and calibration, then confirm the final rate with a timed, weighed catch test at the outlet.
Tube Feed Delivery Estimate
Results estimate delivery from tube area, pitch, rpm, fill, incline derate, feedability, and feed density.
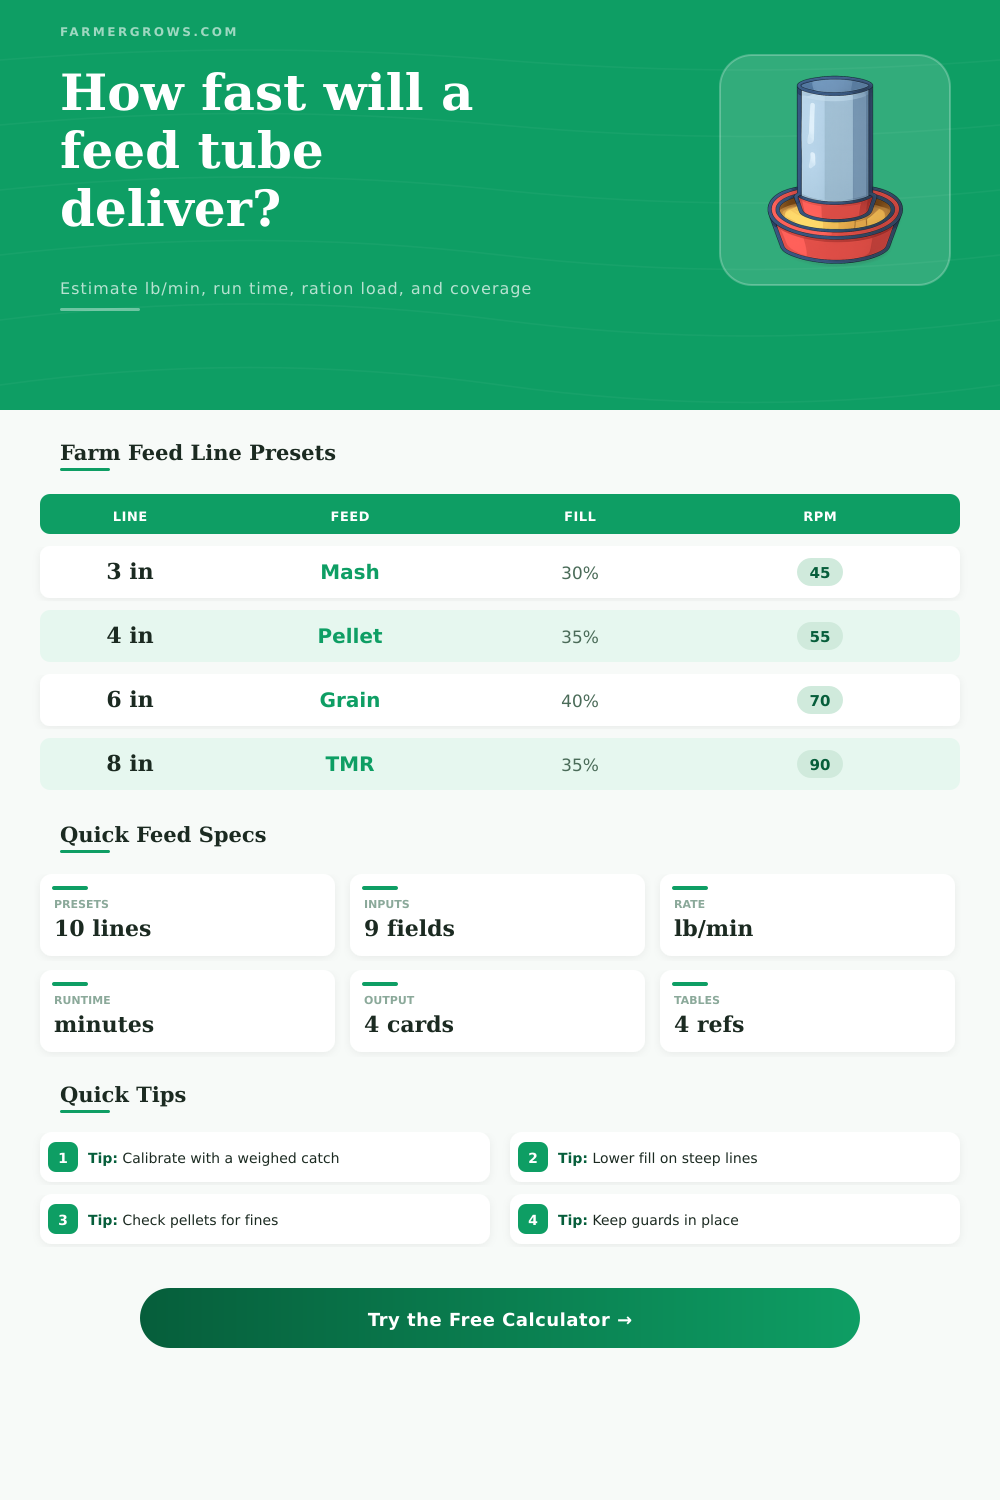
| Tube diameter | Common pitch | Typical rpm range | Practical fill | Common farm use |
|---|---|---|---|---|
| 2 in tube | 1.5 to 2 in | 20 to 60 rpm | 20% to 35% | Mineral, medicated premix, small bins, low-dose lines |
| 3 in tube | 2.5 to 3 in | 35 to 90 rpm | 25% to 40% | Poultry, sheep creep, calf starter, short barn lines |
| 4 in tube | 3.5 to 4 in | 40 to 110 rpm | 30% to 45% | Hog feeders, dairy grain, sow barns, pellet systems |
| 6 in tube | 5 to 6 in | 50 to 140 rpm | 30% to 45% | Cattle bunk feed, grain transfer, TMR ingredients |
| 8 in tube | 7 to 8 in | 60 to 180 rpm | 25% to 40% | Bulk grain, high-capacity feed mill transfer |
| Feed type | Usual density | Feedability factor | Fill guidance | Calibration note |
|---|---|---|---|---|
| Pelleted complete feed | 36 to 42 lb/cu ft | 88% to 100% | 30% to 45% | Watch fines; they lower flow consistency over long runs |
| Mash or meal feed | 28 to 38 lb/cu ft | 75% to 92% | 25% to 38% | Humidity and bridging can make timed feeding drift |
| Whole grain | 42 to 50 lb/cu ft | 90% to 105% | 30% to 45% | Cracked kernels and screenings change density |
| Mineral premix | 55 to 75 lb/cu ft | 70% to 90% | 18% to 32% | Short pulse feeding needs extra catch-test care |
| Damp by-product | 35 to 60 lb/cu ft | 45% to 75% | 15% to 30% | Use conservative fill if the product smears or cakes |
| Incline angle | Capacity factor | Suggested fill | Power watch | Field note |
|---|---|---|---|---|
| 0 to 5 degrees | 1.00 | 30% to 45% | Normal | Best case for horizontal feed tubes and bin takeaways |
| 10 degrees | 0.94 | 28% to 42% | Low | Common barn climb or short bin discharge |
| 20 degrees | 0.82 | 24% to 38% | Moderate | Useful planning derate before setting timer minutes |
| 30 degrees | 0.66 | 18% to 32% | High | Backflow and surging become more likely |
| 45 degrees | 0.40 | 10% to 24% | High | Confirm rate under load before relying on timer settings |
| Example group | Target ration | Total feed | At 20 lb/min | At 60 lb/min |
|---|---|---|---|---|
| 80 broilers or pullets | 0.25 lb/head | 20 lb | 1.0 min | 0.3 min |
| 60 nursery pigs | 1.5 lb/head | 90 lb | 4.5 min | 1.5 min |
| 40 feeder hogs | 5 lb/head | 200 lb | 10.0 min | 3.3 min |
| 75 dairy cows | 8 lb/head | 600 lb | 30.0 min | 10.0 min |
| 120 beef calves | 6 lb/head | 720 lb | 36.0 min | 12.0 min |
Timer calibration: Weigh feed from the farthest outlet for a known runtime. Use that measured lb/min when precision matters for restricted feeding.
Equipment caution: Shut off and lock out power before checking flighting, guards, bearings, blockages, or bin transitions around any auger feed line.
The variable that affect feed delivery are numerous. Each of the variables listed here has the potential to impact the rate at which feed is delivered to the animals. For instance, variables like the diameter of the feed line tubes, the incline of the line, the type of feed, and a number of other factor all play a role in the rate of feed delivery.
A decrease in the diameter of the tubes or the incline of the auger will lead to a decrease in the rate of feed delivery. As a result of decreased feed delivery, the animals may not receive the correct amount of feed. Therefore, it is essential for farmers to understand the impact of each of these variable upon the rate at which the system delivers feed.
What Affects Feed Delivery
The diameter of the auger tubes is one of the main variables that impacts the capacity of the system. Tubes of a given diameter have more capacity than tubes of a smaller diameter. A four-inch diameter tube, for instance, will have more capacity than a three inch diameter tube.
The capacity of the system, however, is not solely based off the diameter of the auger tubes. Factors like the fill percentage, the pitch of the auger, and the revolutions per minute at which the auger turns will also affect the capacity of the system. Additionally, the type of feed also have an impact upon the capacity of the system.
Pellets will easily move through the auger at high levels of fill, but mash and damp feed may bridge and smear within the auger. Because of this potential for bridging and smearing of the damp feed, the farmer will need to adjust the auger settings for mash and damp feed. Another factor that can impact the capacity of the system is the incline of the feed line.
Many people may believe that incline is a variable that has little impact upon the system, but the incline does have a significant impact upon the capacity of the feed line system. For instance, if the incline of the system is ten degrees, the capacity of the system will drop by six percent. If the incline of the system is twenty degrees, however, the capacity will drop by over fifteen percent.
Additionally, the steeper the incline, the more the risk of backflow of the feed within the system and the more power require to move the feed at that rate. A number of factors, such as the humidity within the barn, wear on the auger flighting, or the amount of fines in the pellets will also impact the capacity of the system. A separate factor from the calculations made in the system is the feedability factor.
This factor accounts for variables in the barn that laboratory tests of the feed do not account for. For example, high humidity levels or fines in the feed will require a lowering of the feedability factor. A lowered feedability factor will lead to a lower calculated rate of feed delivery.
An additional variable that will impact the system is the length of the feed line. The length of the feed line will determine how much feed is already within the system when the auger begins to turn. The longer that the feed line is, the more feed that will be within the system and the longer that it will take for feed to reach the most distant pen.
Additionally, the length of the feed line will also place a limit upon the amount of feed that can be moved through the system. The calculator will provide the weight of the feed that is running the line and the amount of feed that can fill the entire tube. These figures will allow the farmers to determine whether or not the motor is delivering new feed to the pens or if it is cycling the feed that is already within the system.
There are several reference tables that provide information regarding the different feeds and the RPMs that may be used in each case. These tables provide information regarding the different densities of the feed and the RPMs of each of the different sizes of auger tubes. Additionally, there are also reference tables regarding the impact that incline has upon the capacity of the feed lines.
These reference tables are a starting point for farmers and technicians to calibrate the feed lines, but should not be used as a replacement for a timed catch test. A timed catch test will allow farmers to weigh the amount of feed that exit the outlet over a period of time. Many farms find that the actual rate of feed delivery is between ten and fifteen percent less then the calculation made by the reference tables.
Each output card will provide information to each farm regarding the management of that farm. For instance, the delivery rate will indicate if the delivery of feed to the animals is within the capabilities of the feed line. The total ration time will indicate how long that the motor must be running in order to provide the amount of feed that is required by the animals.
Additionally, the feed that is delivered in the run and the head that is covered will allow the farm to determine if the motor was allowed to run for long enough to provide feed to the desired amount of pen. Finally, the line-holding estimate will indicate how much feed is already within the system and moving to the pens. As with most systems, small changes each day may affect the rate at which feed is delivered by the system.
Factors like the cracked kernel within the auger flighting, the sag that may occur along a long run of the auger tubes, or even a leaking gate within the feed bin will all have an impact upon the feed rate. In this case, then, the feed line calculator can be used to determine the rate at which feed should be delivered, but the timed catch test can be used to fine-tune those calculations. Use the calculator to determine the rate at which feed should leave the auger tubes when they are running at the determined RPMs with the desired settings for fill percentage and feedability.
After the farmer sets up the feed line at the barn, however, a catch test will allow the farmer to measure the actual rate at which feed leaves the auger. By comparing the calculated rate and the actual rate of feed delivery, the farmer can adjust the timer that controls the motor running the auger.