Butterfat Calculator
Estimate dairy butterfat pounds, protein pounds, 3.5% fat-corrected milk, energy-corrected milk, SCC quality status, and cream yield from milk weight or volume.
Use tested tank or cow sample values when possible. Component formulas are planning estimates for dairy records, cream separation, and herd comparisons; processor pay tests and lab reports remain the authority.
Butterfat and Component Results
Results use milk pounds, tested components, 3.5% FCM, ECM, and separator recovery assumptions.
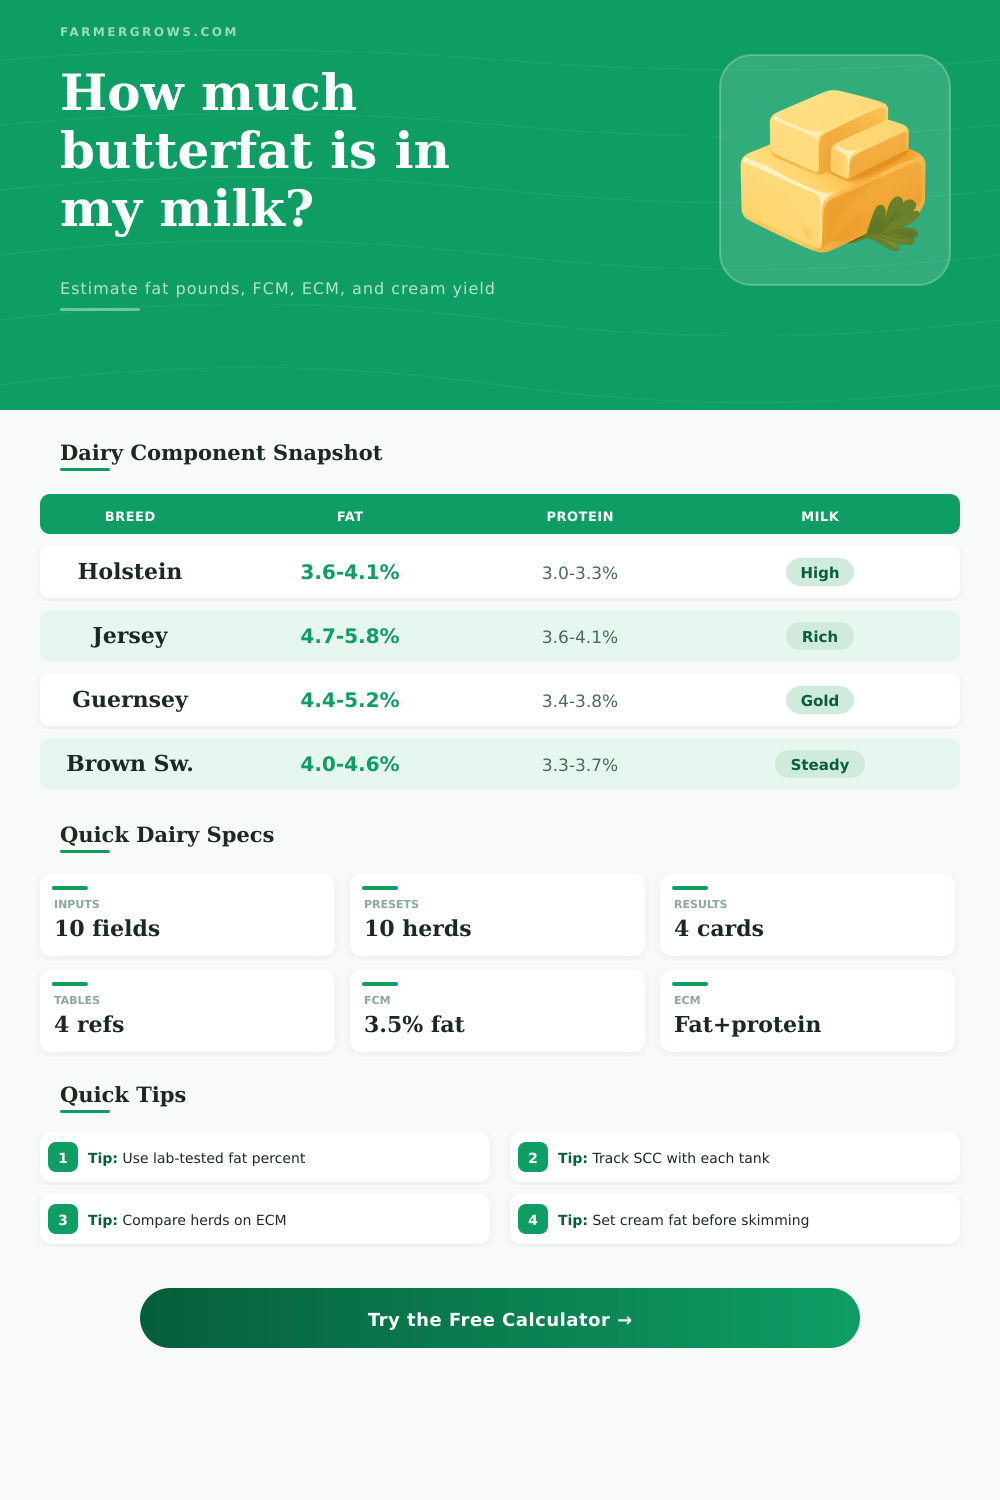
| Breed or profile | Typical butterfat | Typical protein | Planning note |
|---|---|---|---|
| Holstein | 3.6% to 4.1% | 3.0% to 3.3% | High milk volume often drives total component pounds. |
| Jersey | 4.7% to 5.8% | 3.6% to 4.1% | Rich milk is useful for cream and cheese yield checks. |
| Guernsey | 4.4% to 5.2% | 3.4% to 3.8% | Often valued for rich milk and golden color. |
| Brown Swiss | 4.0% to 4.6% | 3.3% to 3.7% | Steady solids profile with good protein percentage. |
| Ayrshire | 3.9% to 4.4% | 3.2% to 3.5% | Moderate solids with practical commercial volume. |
| Mixed herd | 3.8% to 4.8% | 3.1% to 3.7% | Use actual test results rather than breed averages. |
| Milk measure | Approximate pounds | Metric equivalent | Use in calculator |
|---|---|---|---|
| 1 US gallon milk | 8.6 lb | 3.9 kg | Common farm estimate for fluid milk volume. |
| 1 US quart milk | 2.15 lb | 0.98 kg | Small batch or kitchen cream trial. |
| 1 liter milk | 2.27 lb | 1.03 kg | Metric vat and separator records. |
| 1 hundredweight | 100 lb | 45.36 kg | Component pounds per cwt are percent values. |
| 1 metric tonne milk | 2,204.6 lb | 1,000 kg | Large vat or processor shipment estimates. |
| Metric | Formula used | Best comparison | Interpretation |
|---|---|---|---|
| Fat pounds | Milk lb x fat % / 100 | Milk check components | Direct butterfat output from tested milk. |
| Protein pounds | Milk lb x protein % / 100 | Cheese yield planning | Direct protein output from tested milk. |
| 3.5% FCM | 0.4324 x milk lb + 16.216 x fat lb | Fat-adjusted milk | Normalizes milk to a 3.5% butterfat basis. |
| ECM | 0.327 x milk lb + 12.95 x fat lb + 7.2 x protein lb | Energy output | Credits milk volume, fat, and protein together. |
| Cream yield | Recovered fat lb / cream fat fraction | Separator planning | Estimates pounds of cream at target fat percent. |
| Target | Strong range | Watch range | Management note |
|---|---|---|---|
| Butterfat test | Breed range or higher | Below breed low | Check ration fiber, heat stress, and sampling. |
| Protein test | Breed range or higher | Below breed low | Watch energy balance and stage of lactation. |
| SCC premium | Under 200,000 | 200,000 to 400,000 | Track mastitis control and milking routine. |
| FCM response | Above actual milk | Below actual milk | High butterfat lifts FCM over raw milk pounds. |
| ECM response | Above actual milk | Flat or lower | High components lift energy-corrected output. |
For component records: Compare fat pounds and protein pounds per cow, not only percent. A lower test on much more milk can still produce more saleable solids.
For cream separation: Cream yield depends on recovery and target cream fat. Separator setup, milk temperature, and bowl condition can shift the real yield.
Dairy producers pay close attention to milk components because milk components represent the producer’s money, time, and the health of the herd. The butterfat percentage in milk is a valuable component because it will tell you how much cream you can produce from the milk, how much cheese a vat might yield, or if the feeding programs for the herd is working. The protein percentage in milk are important to dairy farmers because cheese plants depend upon the protein in milk and component prices includes protein in their costs for milk components.
The raw percentages of each milk component dont necessarily equal the pound of milk sold or cream separated from the herd. A calculation tool will provide milk components with a number you can use to calculate specific components of milk. The first step in calculating the milk components is to decide how you will weigh the milk entering the farm.
Track Milk Fat, Protein and Quality
If you weigh every tank of milk that enters the farm, you can use the milk component percentages and convert those percentages to the total pound of butterfat and protein produced by the herd. The total pounds of butterfat and protein are more accurate than the percentages of milk components. For instance, a Holstein herd that produces 20,000 pounds of milk at 3.7 percent butterfat will have more total pound of butterfat than a herd of Jersey cows that produces the same amount of milk but at 5 percent butterfat.
However, the Jersey herd may have more butterfat per cow. Seeing the total pounds and the percentage of components will allow you to compare the two herds without making an erroneous decision based off the percentage value of milk components alone. The next input into the calculation tool is the somatic cell count of the milk.
The somatic cell count will not change the total pounds of butterfat and protein produced by the herd. However, high counts of somatic cells will change the monetary value of that butterfat and protein. Milk buyers will pay less for milk with high somatic counts as they indicate more cases of mastitis in the herd.
The somatic cell count is often not measured until after milk components are measured. However, the calculation tool will flag which quality band for somatic cells the milk is in so that the dairy farmer dont have to remember the somatic cell count values for each herd. Other variables that can be entered into the calculation tool include the days in milk for each cow in the herd and the breed of each cow.
Cows that are in early days in milk will have low percentages of butterfat in their milk. However, cows that are in late days in milk will have higher concentrations of milk solids. Some breeds of cows, such as Jersey, Guernsey, and Brown Swiss will have different components of milk than Holsteins.
For instance, the percentage of milk components that a cow in a specific breed obtains may be excellent for that breed but disappointing for another breed. The calculation tool remember the ranges of milk components for each breed so that the farmer doesnt have to remember these ranges of values every time a component is calculated for the herd. After entering the data for the milk components of the milk sold by the dairy farm, the calculation tool will provide information on the fat-corrected milk and energy-corrected milk values produced by the herd.
These values provide a means of comparing the energy output from two different rations of hay, silage, grains, and other feed for dairy cows or to compare the energy output of the herd during two different seasons. Similarly, the herd’s cream yield can be calculated using the same logic used to calculate the pounds of milk components. If the amount of butterfat that is recovered from the cream and the fat percentage for which the cream separator is set will allow the dairy farmer to calculate the pounds of cream that should be produced by the herd.
Knowing the number of pounds of cream that the herd will yield will allow the farmer to decide if the separator needs to be adjusted or if the milk components has changed. The page includes reference tables for the typical fat and protein components of each breed of dairy cow and the number of gallons of milk that contain a certain number of pounds of milk. These tables also list the formulas for calculating fat-corrected milk and energy-corrected milk.
While not a means of diagnosing milk and milk components, the calculation tool helps to remove the arithmetic work for calculating the values of milk components. Using the calculation tool will be most effective if the same inputs are entered into the tool each week or each two weeks. If the ration provided to the herd changes, the calculation tool will allow the farmer to notice if the components of milk change without the volume of milk sold by the herd change.
Similarly, if there are spikes in the somatic cell count, the farmer can use the calculation tool to recognize that the pounds of butterfat and protein is decreasing along with the milk component premiums for those high counts. Component tracking is about finding the perfect test for milk components. However, component tracking is not about that perfect test but rather understanding the tradeoffs between each component in the milk.
The volume of milk, the butterfat, protein, and quality of milk components affect one another. Each component should be watched alongside the others to transform the weight of the milk sold by the herd into useful information for the dairy farm.