Soil Compaction Calculator
Estimate field traffic compaction risk from axle load, tire pressure or contact area, soil moisture, texture, passes, traffic control, and intended working depth.
Use this as a field planning estimate before harvest, manure hauling, spraying, planting, or tillage. Real soil strength changes by structure, drainage, residue, cover crop roots, and subsoil history.
Compaction Risk Results
Results combine estimated ground contact stress, axle-load depth pressure, moisture weakness, texture sensitivity, repeat passes, and controlled traffic offset.
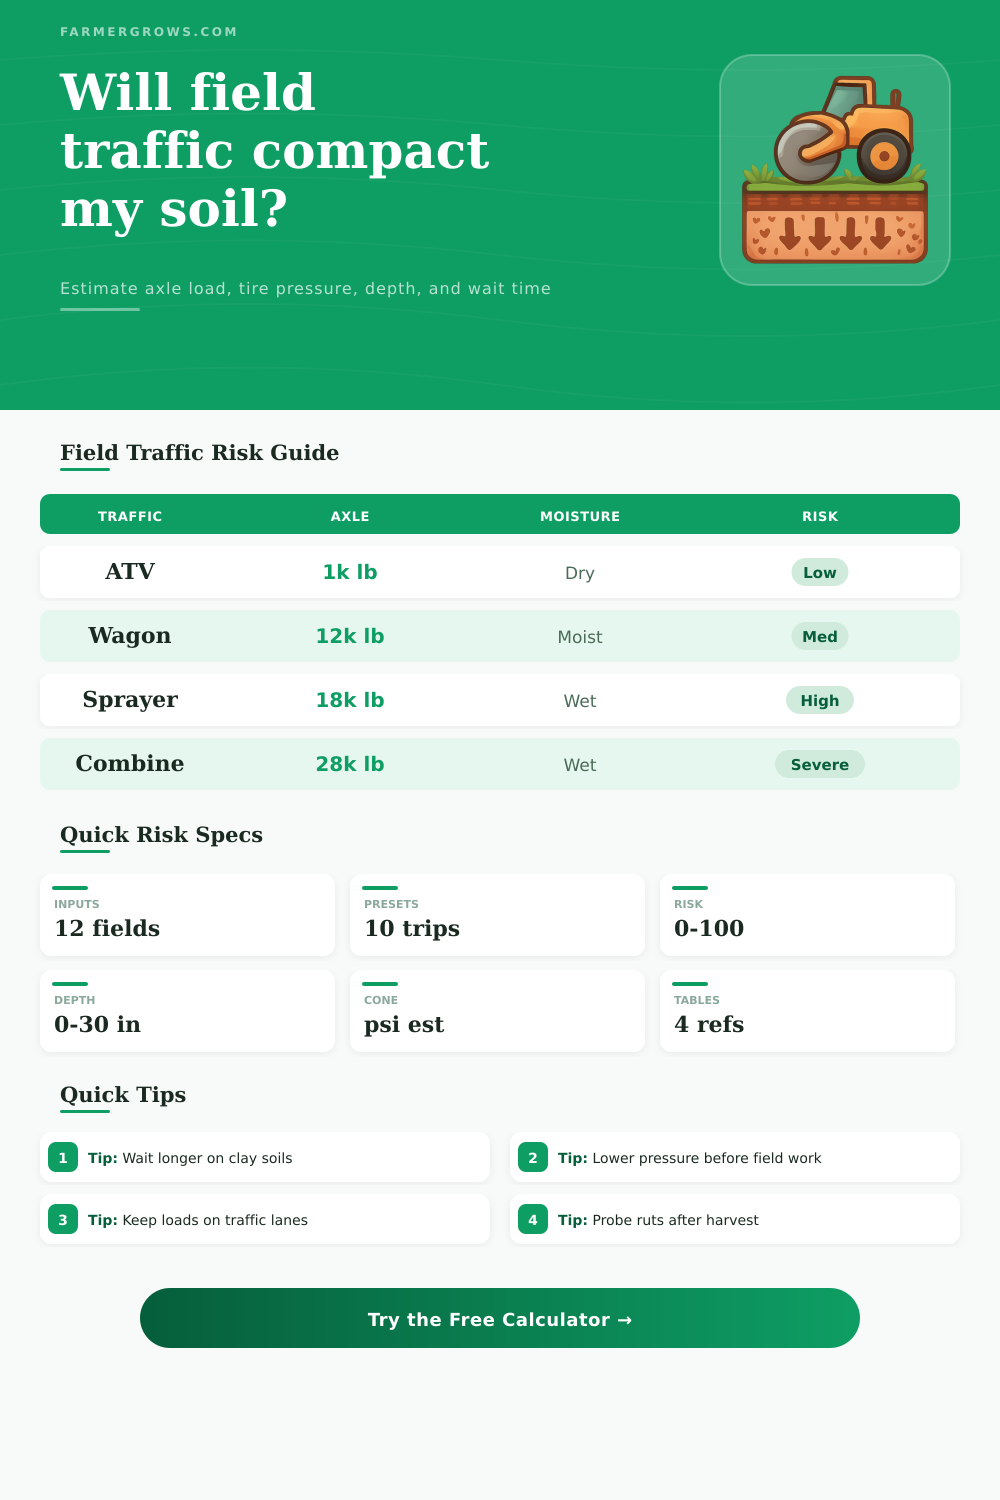
| Traffic type | Typical axle load | Surface concern | Subsoil concern | Field note |
|---|---|---|---|---|
| UTV or small mower | 800 to 1,500 lb | Low unless very wet | Usually shallow | Still avoid repeated turns in beds or headlands |
| Planter tractor axle | 8,000 to 16,000 lb | Tire pressure matters | Moderate at moist field capacity | Lower inflation when tire rating allows |
| Self-propelled sprayer | 14,000 to 24,000 lb | Rutting on wet silt | Can reach the rooting zone | Wide tires and timing change the result sharply |
| Loaded grain cart axle | 22,000 to 45,000 lb | High surface stress | High deep compaction risk | Keep cart paths fixed whenever possible |
| Manure tanker axle | 18,000 to 35,000 lb | High when soil is wet | High under repeated trips | Wait for drier soil or use controlled lanes |
| Soil texture | Moisture sensitivity | Bulk density caution | Traffic window | Compaction pattern |
|---|---|---|---|---|
| Sand or loamy sand | Lower after drainage | 1.60 to 1.70 g/cm³ | Shorter wait after rain | Surface densification and traffic lanes |
| Sandy loam | Moderate | 1.55 to 1.65 g/cm³ | Wait until friable | Wheel track compaction in topsoil |
| Loam | Moderate to high | 1.45 to 1.55 g/cm³ | Good timing matters | Topsoil and mid-depth risk |
| Silt loam | High | 1.40 to 1.50 g/cm³ | Slow if saturated | Ruts, smearing, platy layers |
| Clay loam or clay | Very high | 1.30 to 1.45 g/cm³ | Often needs extra days | Deep smearing and dense subsoil |
| Moisture state | % field capacity | Traffic rating | Penetrometer clue | Action |
|---|---|---|---|---|
| Dry and crumbly | 45% to 65% | Best carrying strength | Probe enters with steady force | Proceed if axle loads are reasonable |
| Friable | 65% to 80% | Usable for many jobs | Ball breaks with light pressure | Use lower pressure and reduce passes |
| Moist near field capacity | 80% to 100% | Caution | Ball ribbons or smears | Delay heavy axles if possible |
| Wet or saturated | 100% to 120%+ | High risk | Ruts or shiny smear appear | Wait, reroute, or keep to lanes |
| Mitigation lever | Main effect | Risk reduction | Best use | Watchout |
|---|---|---|---|---|
| Lower tire pressure | Larger contact patch | Surface stress reduction | Planting, spraying, grain haul support | Stay inside tire load charts |
| Controlled traffic | Confines damage | Whole-field risk reduction | Repeated sprayer, cart, and harvest lanes | Lane soil can become very dense |
| Reduce axle load | Lowers deep stress | Subsoil protection | Partial loads, smaller carts, more unload points | More trips can add surface passes |
| Wait for drying | Raises soil strength | Moisture risk reduction | Fine-textured soils after rain | Delayed fieldwork may affect timing |
| Residue or sod cover | Improves bearing near surface | Small to moderate | Hay, cover crops, no-till fields | Does not cancel heavy axle risk |
Before entering: Check the wettest headland first. If the tire smears soil or water shines in the rut, the calculator should be treated as optimistic.
After traffic: Probe across and between wheel tracks at several depths. A sudden jump in resistance often marks the layer that needs biological recovery or targeted loosening.
Soil compaction is a problem that occurs in the soil after heavy equipment has traveled across the field. Although soil compaction may not be visible on the soil’s surface, soil compaction can cause crops to struggle in the following growing season due to the restricted growth of the crop’s root. The strength of the soil determine the amount of damage that the traveling equipment will do to the soil.
Therefore, farmers must consider these factors before allowing heavy equipment into the field. There are variable in the calculator that determine the risk of soil compaction. The variables include the axle load, the tire setup, and the soil condition.
How to Use the Soil Compaction Risk Calculator
The calculator measure the contact pressure that the equipment will make with the soil’s surface and the depth that the contact pressure will travel into the soil. The soil texture and soil moisture level will change how the contact pressure affect the soil. For example, a heavy axle load placed on wet clay soil will have a more different effect on the soil than a heavy axle load placed on dry loam soil.
Soil moisture level is one of the variable that will affect soil compaction. Soil particles will move easy when the soil moisture level is at field capacity. Because soil particles are moving easy, soil compaction will create deeper ruts in the soil than if the same load is placed on dry soil.
The calculator will use a moisture factor to calculate soil compaction under these condition. The moisture factor will increase if the soil moisture level moves past eighty percent of the field capacity. Soil texture will change how moisture affect soil compaction.
For example, sandy soil will drain water quick and recover it’s bearing strength quickly but may still form a pan on the soils surface. Clay soil will hold water longer and will require more drying time before it regains its soil structure that resist smearing. Tire pressure and contact area will affect soil compaction.
By lowering the pressure in the tire, more square inch will be in contact with the soil. Using more square inches of the tire in contact with the soil will even out the soil pressure. This will help the top layer of soil, but it will not eliminate the stress that the total weight of the axle will create on the soil.
The calculator will separate the effects of tire pressure and axle weight to allow farmers to see if a change in tire make soil compaction less of a risk factor. Repeated passes of equipment over the same track in the field will lead to soil compaction. The first pass will create most of the soil compaction.
However, the remaining passes will continue to compact the soil. Controlled traffic systems will reduce the amount of soil that get compacted. Controlled traffic systems will reduce the total risk factor for soil compaction.
The soil compaction risk calculator will lower the risk score when farmers introduce a percentage of controlled traffic systems into the field. Bulk density is a measurement of soil compaction. However, soil texture also affects root growth restriction.
For example, sandy loam soil can withstand higher bulk density than silt loam soil. Silt soil will reach its limit for root growth at a lower bulk density than sandy loam soil. The reference table will illustrate the bulk densities for each soil texture so that farmers can determine if the bulk density of their soil will affect their crop.
Penetrometer readings will help determine if soil compaction has happened in the field. The soil compaction risk calculator will give farmers an estimated cone resistance value. This estimated value will help determine where to place penetrometers in the field.
A penetrometer will reveal a sudden increase in resistance if soil compaction has occurred. This area will require biological soil recovery with cover crops or a tillage pass to loosen the soil. Waiting for the soil to dry will prevent soil compaction.
However, waiting for the soil to dry can create a conflict in the farming schedule. The drying time estimate isnt exact but will give the farmer an idea of how many days the soil will take to reach a point where soil compaction is less of a risk factor. Clay soil will take more time to dry than sandy soil.
Therefore, the soil texture selected by the farmer will change the drying time estimate for the soil. Farmers must choose the proper equipment for the soil condition in which they will travel. Heavy loads placed on moist, fine-textured soil will cause problem that are expensive to repair.
However, heavy loads will not cause as many problems with dry, coarse soil. Using the soil compaction risk calculator will allow farmers to test the different equipment scenarios before placing any heavy equipment in the field. Using the calculator will give them an idea of the trade-offs between the different scenarios to help them make the best decision for there field.